How to filter onchain data: farmed volume, round trips, and dust
Four checks for farmed volume, round trips, and dust in onchain data. Two wallets were 64% of tokenized-stock transfer value on Solana, and transfers under $0.01 were 25% of Ethereum's stablecoin transfer count.

Head of Operations
A raw transfer or swap count can overstate real onchain activity. Four checks on transfer and swap data catch most of the gap. Check 1 asks whether a wallet ends a window with no new position. Check 2 asks whether the same value leaves and returns in one transaction. Check 3 ranks top wallets and tests whether they round-trip. Check 4 buckets transfers by dollar size to find a dust threshold. Running these checks on data Goldsky computed found two wallets behind 63.64% of $30.21B in tokenized-stock transfers on Solana. It also found a lending contract where 97.6% of a $64.8B weekly inflow was a same-transaction round trip. It found a token pool, where one wallet made 84.3% of swap volume. On the dust side, transfers under $0.01 are 24.6% of Ethereum's transfer count and 9.6% of Solana's, against near zero value. None of these results means the activity is small. Tokenized stocks on Solana moved $10.98B over 34 days without the two wallets.
Check 1: does the wallet end with a position?
A wallet that buys and sells the same asset, ending a window near its starting balance, is not building or exiting a position. The rule: sum bought and sold token amount per mint per wallet over the window, then compare.
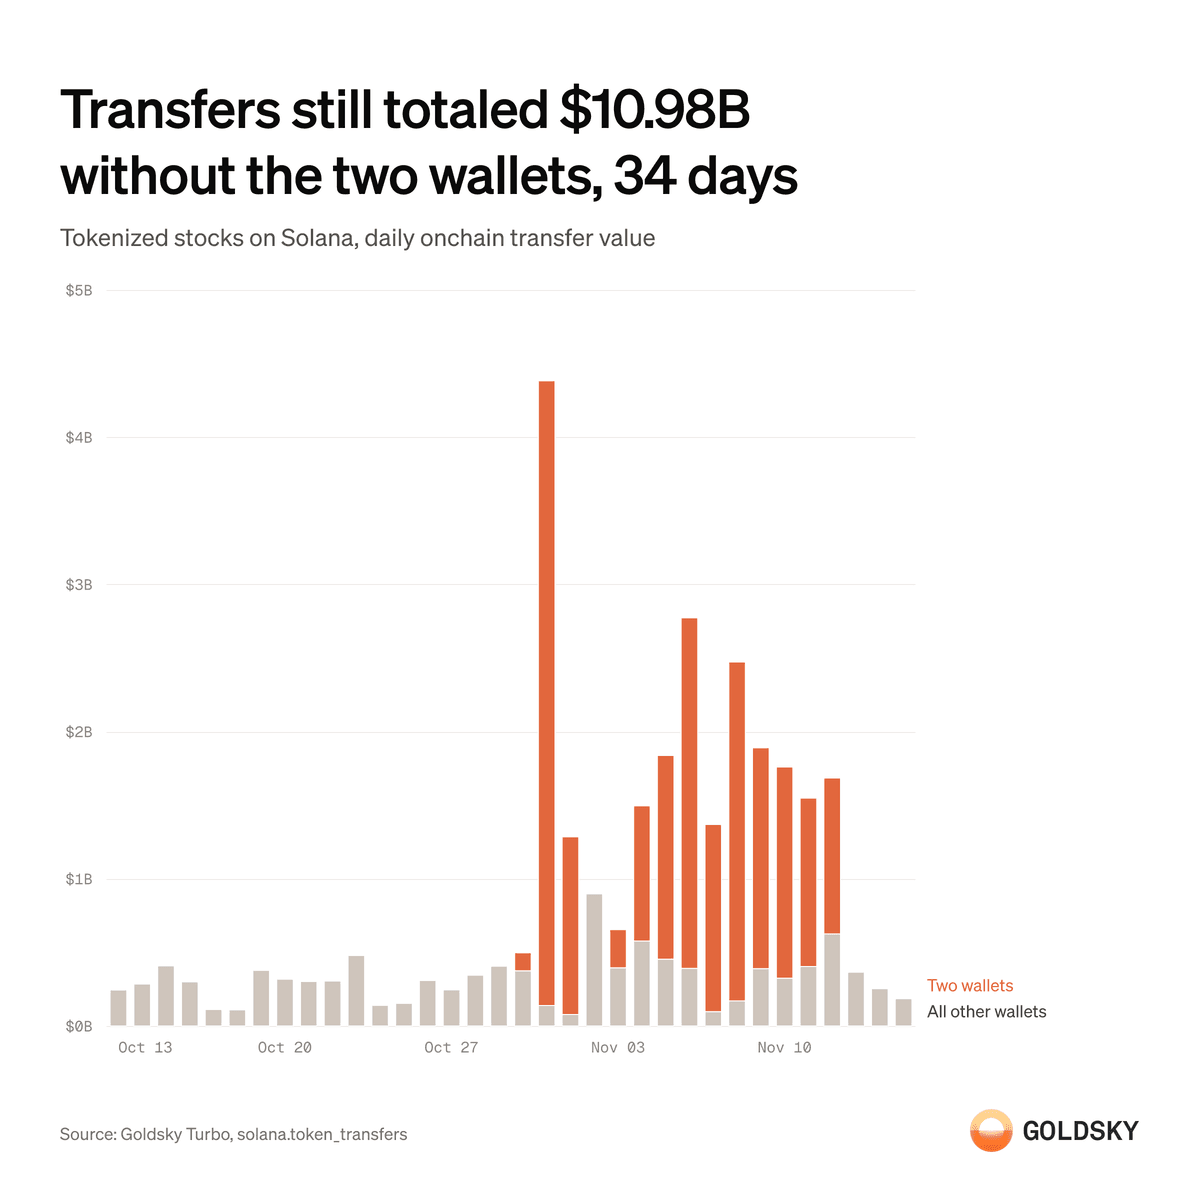
Example: two wallets on Solana's tokenized-stock market, Oct 13 to Nov 15, 2026 (34 days). The two wallets together carried 63.64% of $30.21B in all-venue transfer value. For every mint each wallet touched, the raw token amount bought equals the raw amount sold, to within floating-point noise.
| Wallet | Mints traded | Lifetime bought | Lifetime sold | Net |
|---|---|---|---|---|
| Wallet 1 (active Oct 27 to Nov 11) | 17 | $8,877,213,133 | $8,877,213,157 | +$23 |
| Wallet 2 (active Nov 11 to 12) | 5 | $736,495,820 | $736,495,820 | $0 |
SQL rule, from the query behind this check (W is the wallet address under test):
SELECT toDate(toDateTime(block_timestamp)) AS day, token_mint_address AS mint,
       any(decimals) AS decimals,
       sumIf(amount, to_owner = {W:String}) AS bought_raw,
       sumIf(amount, from_owner = {W:String}) AS sold_raw,
       count() AS n
FROM solana_tokenized_stocks_transfers_20261013_20261111 FINAL
WHERE status = 1 AND (from_owner = {W:String} OR to_owner = {W:String})
GROUP BY day, mint ORDER BY day, mint;This example fails check 1 and the concentration half of check 3. Both wallets close every mint at net zero. They also carry 63.64% of the period's transfer value, the concentration measure check 3 uses below on a different asset. Median fill size for both wallets' top mints runs $460 to $825, consistent with a fixed-size automated execution pattern, not human-sized orders.
Two wallets carry 63.64% of the tokenized-stock transfer value this series tracks, and both close every mint at net zero. Without them, the 34-day series totals $10.98B, with daily value from $78.1M (Nov 1) to $898.6M (Nov 2).
Check 2: does the same value go in and out in one transaction?
A contract receives a transfer, then sends a matching transfer of the same amount back out in the same transaction. That pattern opens and closes a loan in one block. The rule: for each transaction hash, match an inbound transfer against an outbound one of the same raw amount.
Example: USDC on Ethereum, week of Nov 2 to Nov 8, 2026, inflow to a Morpho lending contract. Morpho documents flash loans (opens in a new tab) as a feature. A flash loan borrows and repays inside a single transaction. 97.63% of this week's $64.80B gross inflow carried that same-transaction, same-amount pattern.
| Window | Gross inflow | Flash-loan dollars | Flash share | Inflow excluding flash loans |
|---|---|---|---|---|
| Week of Oct 26 | $54.55B | $52.73B | 96.66% | $1.82B |
| Week of Nov 2 | $64.80B | $63.27B | 97.63% | $1.53B |
SQL rule, from the query behind this check:
morpho_out AS (
  SELECT DISTINCT txh, raw_amt FROM decoded WHERE from_addr = '0xbbbbbbbbbb9cc5e90e3b3af64bdaf62c37eeffcb'
),
ins AS (
  SELECT wndw, txh, from_addr, raw_amt,
    (txh, raw_amt) IN (SELECT txh, raw_amt FROM morpho_out) AS is_flash
  FROM decoded WHERE to_addr = '0xbbbbbbbbbb9cc5e90e3b3af64bdaf62c37eeffcb'
)Ethereum-wide USDC transfer volume, counting every transaction that touches a flash-loan pattern, rose 29.01% week over week. The same volume, with those transactions removed, fell 5.18%. The contract's net flow after the flash-loan legs cancel is +$2.7M, a small fraction of either week's gross figure.
Check 3: how much of the value comes from the top wallets, and do they round-trip?
A market where one wallet carries most of the volume has less independent trading than its volume total suggests. This is true when that wallet's own buys and sells largely cancel within minutes. The rule: rank wallets by volume share. Then flag a trade when the same wallet has an opposite-direction trade within a short window, at a matching amount.
Example: one euro-denominated stablecoin on Solana, week of Nov 2 to Nov 8, 2026. One wallet made 84.3% of this pool's $14.54M weekly DEX volume. 77.7% of the week's volume was the same wallet trading opposite directions within 600 seconds, at amounts within 1% of each other.
| Metric | Value |
|---|---|
| Weekly DEX volume | $14,538,730.94 |
| Top wallet's share | 84.3% |
| Top 10 wallets' share | 93.3% |
| Round-trip share of weekly volume | 77.7% |
SQL rule, from the query behind this check (the round-trip join):
SELECT a.id aid, a.usd_vol usd_vol,
  max(
    (b.direction != a.direction)
    AND abs(b.ts - a.ts) <= 600
    AND abs(b.usd_vol - a.usd_vol) / greatest(b.usd_vol, a.usd_vol) <= 0.01
  ) AS has_pair
FROM w2 a
JOIN w2 b ON a.trader = b.trader AND a.id != b.id
WHERE a.direction != b.direction
GROUP BY a.id, a.usd_volOne wallet made 84.3% of this pool's $14.54M weekly volume, and 77.7% of the volume cancels within 10 minutes. The pool runs on one DEX in both weeks, so routing across venues does not produce the round trips.
Check 4: what dollar size counts as dust?
A size-band breakdown splits transfer count from transfer value by dollar amount. The rule: bucket each transfer into six bands from zero to $1,000 and above. Compare each band's share of count against its share of value. For the two smallest bands, also check the top 10 senders' share of the band's count.
Example: Ethereum and Solana stablecoin transfers, Oct 15 to Nov 8, 2026 (24 days). The window and the mint and burn exclusions match Goldsky's post on how to track stablecoin flows onchain. Every band held at least one transfer on both chains.
| Chain | Band | Transfers | Share of count | Value | Share of value | Distinct senders |
|---|---|---|---|---|---|---|
| Ethereum | zero | 3,468,234 | 11.46% | $0 | 0.000% | 934,776 |
| Ethereum | above $0, under $0.01 | 3,976,485 | 13.14% | $1.8K | 0.000% | 679,423 |
| Ethereum | $0.01 to <$1 | 1,293,023 | 4.27% | $387K | 0.000% | 247,778 |
| Ethereum | $1 to <$10 | 1,683,112 | 5.56% | $8.1M | 0.001% | 365,578 |
| Ethereum | $10 to <$1,000 | 13,642,972 | 45.08% | $2.97B | 0.183% | 2,281,921 |
| Ethereum | $1,000 and above | 6,200,044 | 20.49% | $1.62T | 99.816% | 857,515 |
| Solana | zero | 2,809,420 | 0.82% | $0 | 0.000% | 121,674 |
| Solana | above $0, under $0.01 | 30,005,462 | 8.80% | $70K | 0.000% | 2,075,058 |
| Solana | $0.01 to <$1 | 77,371,694 | 22.69% | $21.9M | 0.007% | 2,108,821 |
| Solana | $1 to <$10 | 64,998,483 | 19.06% | $288M | 0.093% | 1,855,515 |
| Solana | $10 to <$1,000 | 152,562,549 | 44.75% | $25.3B | 8.154% | 3,759,964 |
| Solana | $1,000 and above | 13,192,616 | 3.87% | $285.2B | 91.746% | 471,115 |
Top-10 senders' share of count, two smallest bands:
| Chain | Band | Band total transfers | Top-10 senders' transfers | Top-10 share |
|---|---|---|---|---|
| Ethereum | zero | 3,468,234 | 22,863 | 0.66% |
| Ethereum | above $0, under $0.01 | 3,976,485 | 1,505,377 | 37.86% |
| Solana | zero | 2,809,420 | 324,588 | 11.55% |
| Solana | above $0, under $0.01 | 30,005,462 | 7,294,160 | 24.31% |
SQL rule, from the query behind this check:
SELECT
  multiIf(amount = 0, 'zero', amount/1e6 < 0.01, '>$0 and <$0.01',
          amount/1e6 < 1, '$0.01 to <$1', amount/1e6 < 10, '$1 to <$10',
          amount/1e6 < 1000, '$10 to <$1,000', '$1,000 and above') AS band,
  count() AS transfer_count, round(sum(amount)/1e6, 2) AS volume,
  uniqExact(sender) AS distinct_senders
FROM eth_stablecoin_transfers FINAL
WHERE is_deleted = 0
  AND sender != '0x0000000000000000000000000000000000000000'
  AND recipient != '0x0000000000000000000000000000000000000000'
  AND block_timestamp >= toUnixTimestamp('2026-10-15 00:00:00') AND block_timestamp < toUnixTimestamp('2026-11-08 00:00:00')
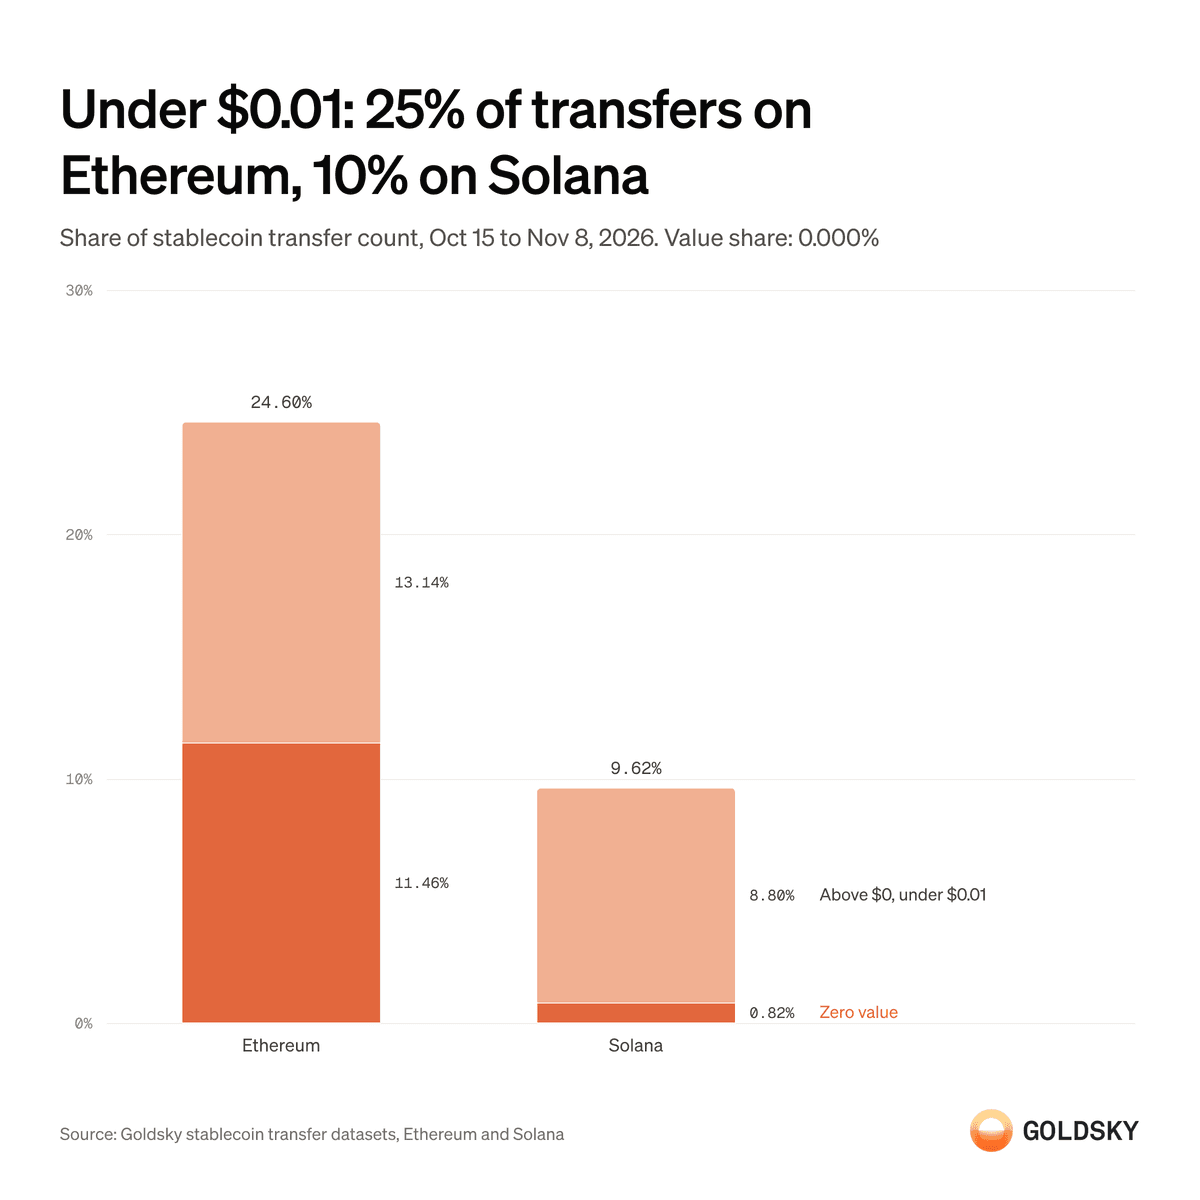
GROUP BY band ORDER BY volume DESCThis example sets the dust threshold at under $0.01, not under $1,000. Zero-value and under-$0.01 transfers together are 24.60% of Ethereum's transfer count and 9.62% of Solana's, and 0.000% of either chain's value. Transfers under $1,000 still carry 0.18% of Ethereum's value and 8.25% of Solana's.
A stablecoin transfer count for Ethereum falls by a quarter when transfers under $0.01 are removed, and the value does not change. Zero-value token transfers are the pattern that address-poisoning campaigns use, and Etherscan has hidden them by default since April 2023 (opens in a new tab). On Ethereum they are 11.46% of the count, spread across 934,776 senders (the top 10 hold 0.66%). The band above zero and under $0.01 is concentrated: 10 senders made 37.86% of it on Ethereum and 24.31% on Solana.
Method
- Check 1 uses a table of tokenized-stock transfers built with the
solana.token_transfers(opens in a new tab) Turbo dataset, filtered to a registry of 1,609 token addresses. - Check 2 and check 4's Ethereum rows use the EVM
raw_logs(opens in a new tab) dataset, decoded for theTransferevent (see Goldsky's decoding guide (opens in a new tab)). - Check 3's swap rows use the
solana.dex_swaps(opens in a new tab) Turbo dataset. - Check 4's Solana rows use the
solana.stablecoin_transfers(opens in a new tab) Turbo dataset.
Every query dedupes on each table's own ReplacingMergeTree pattern, keeping the latest row by insert timestamp.
Check 1's window is 34 days (Oct 13 to Nov 15). Check 2 covers the weeks of Oct 26 and Nov 2. Check 3 covers the week of Nov 2. Check 4 covers Oct 15 to Nov 8.
FAQ
Does a check that flags a wallet or a pool mean that activity is fake?
No. Each check measures one pattern: a flat position, a same-transaction round trip, wallet concentration, or transfer size. A failed check means that pattern is present, not a motive.
Do these checks apply to swap data the same way as transfer data?
Mostly, with one difference. A transfer table carries a sender, a recipient, and an amount, so check 1 and check 2 read it directly. A swap table carries a trader plus a bought and sold amount. Check 3's round-trip rule matches a trader's own opposite-direction trades, not two sides of one transfer.
Why does the dust check use under $0.01 as the threshold, not under $1,000?
Under $1,000 still carries 0.18% of Ethereum's value and 8.25% of Solana's. Under $0.01 carries 0.000% of either chain's value while covering a quarter of Ethereum's count and a tenth of Solana's. A different cutoff re-runs the same multiIf rule with its own thresholds.
How does a team run these checks on its own data with Goldsky?
Add the relevant Turbo Pipelines source: solana.token_transfers, solana.stablecoin_transfers, or the EVM raw_logs dataset (opens in a new tab). Stream it into a database, then run the four rules above as SQL. Goldsky's decoding guide (opens in a new tab) covers turning raw logs into typed Transfer rows first.
Does a low score on these checks mean a chain or an asset has low real usage?
Not on its own. Tokenized stocks on Solana moved $10.98B over 34 days excluding the two wallets, with daily value from $78.1M to $898.6M. A check result describes one pattern in one window, not the whole market.
 Robinhood
 HyperEVM
 Arc
 Solana
 Ethereum
 Polymarket
 Base
 Tempo
 Bitcoin
