USDC transfer tracker: weekly and 3-year volume across 5 chains
Goldsky recorded 120.0 million USDC transfers worth $544.2 billion on 5 chains in the week to Nov 2, 2026. Mint and burn shares by chain, 3 years of monthly volume, and stablecoin rule dates.

Head of Operations
Goldsky recorded 120.0 million USDC transfers worth $544.2 billion on Ethereum, Base, Solana, Arbitrum One, and Arc from 2026-10-26 to 2026-11-02 UTC. Ethereum carried the most volume, $272.1 billion. Solana carried the most transfers, 81.9 million.
7-day USDC transfers by chain
| Chain | Transfers | Volume (USDC) |
|---|---|---|
| Ethereum | 4,055,751 | $272,078,632,456 |
| Base | 26,128,758 | $175,432,432,146 |
| Solana | 81,883,151 | $77,726,226,793 |
| Arbitrum One | 7,054,070 | $14,223,470,399 |
| Arc | 863,294 | $4,762,404,624 |
| Total | 119,985,024 | $544,223,166,417 |
Window: 2026-10-26 00:00 to 2026-11-02 00:00 UTC.
Mints, burns, and transfers by chain
Each USDC movement in this data has one of three types. A mint comes from the zero address and adds new USDC. A burn goes to the zero address and removes USDC. Every other movement is a transfer between two holders.
Transfers between holders are 97.8% to 99.97% of the transfer count on every chain. Mints and burns are a larger share of the dollar volume.
| Chain | Mint and burn share of volume |
|---|---|
| Arc | 65.8% |
| Arbitrum One | 20.2% |
| Solana | 9.6% |
| Ethereum | 4.2% |
| Base | 1.4% |
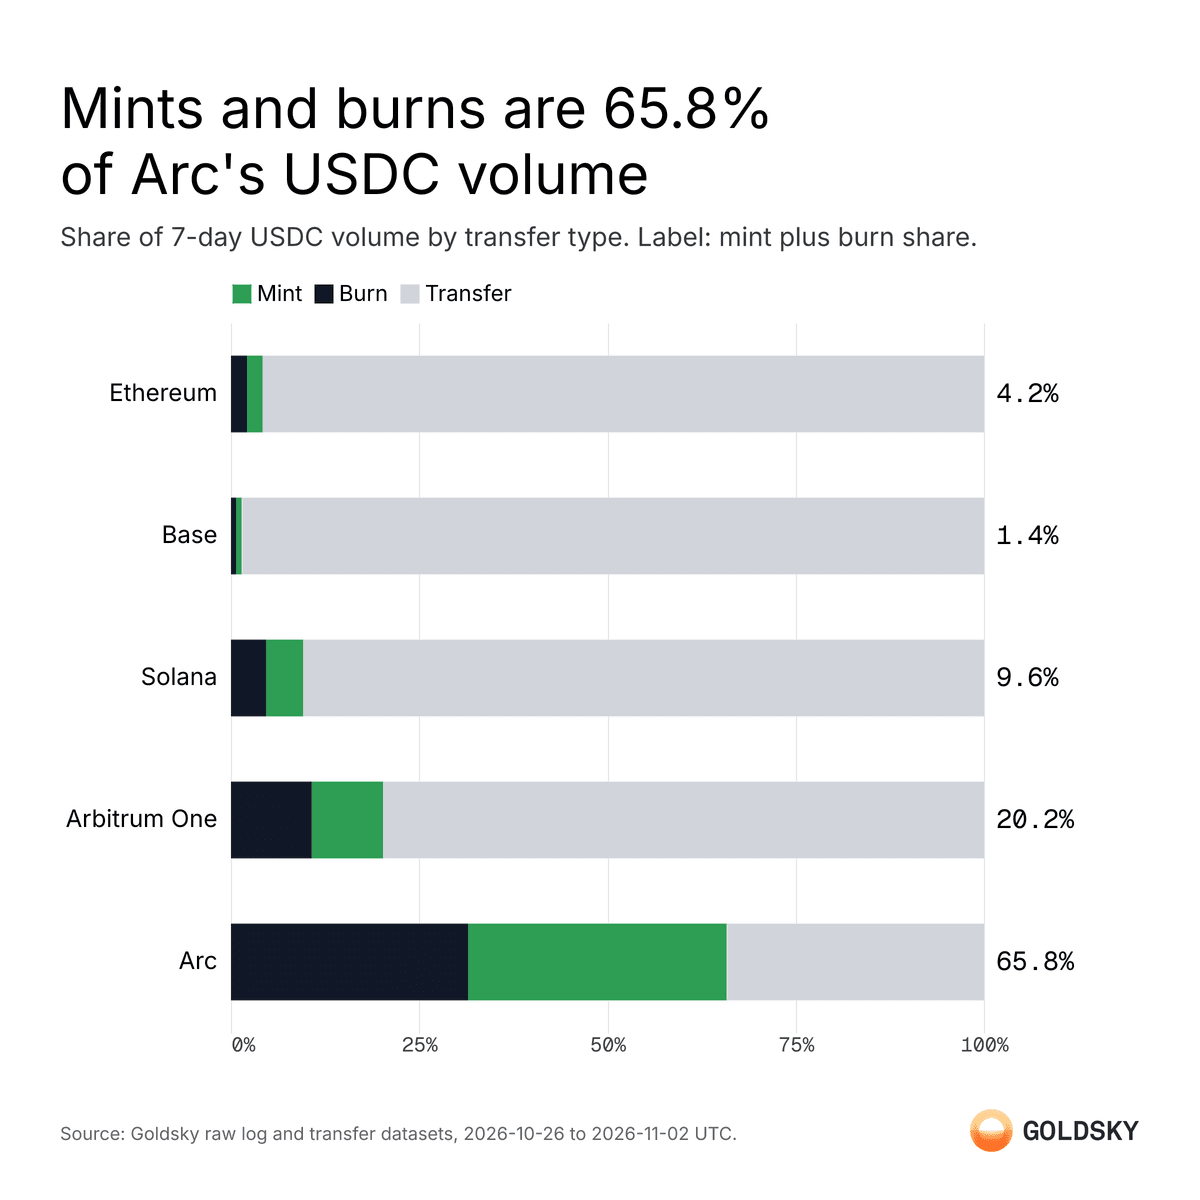
On Arc, mints and burns moved $3.13 billion of the week's $4.76 billion. On Solana, 30 mints moved $3.83 billion, an average of $127.7 million per mint.
3 years of monthly USDC volume
Goldsky's data covers Ethereum, Base, and Arbitrum One from November 2023. Solana data starts on 2026-08-23. Arc data starts on 2026-09-16, the day Arc opened to the public.
From November 2023 to October 2026:
- Ethereum's monthly USDC volume grew from $152.7 billion to $1,134.7 billion, 7.4 times.
- Base's monthly volume grew from $843 million to $2,648.3 billion.
- Arbitrum One's monthly volume grew from $17.6 billion to $49.2 billion, 2.8 times.
- The three chains together grew from $171.2 billion to $3,832.2 billion, 22.4 times.
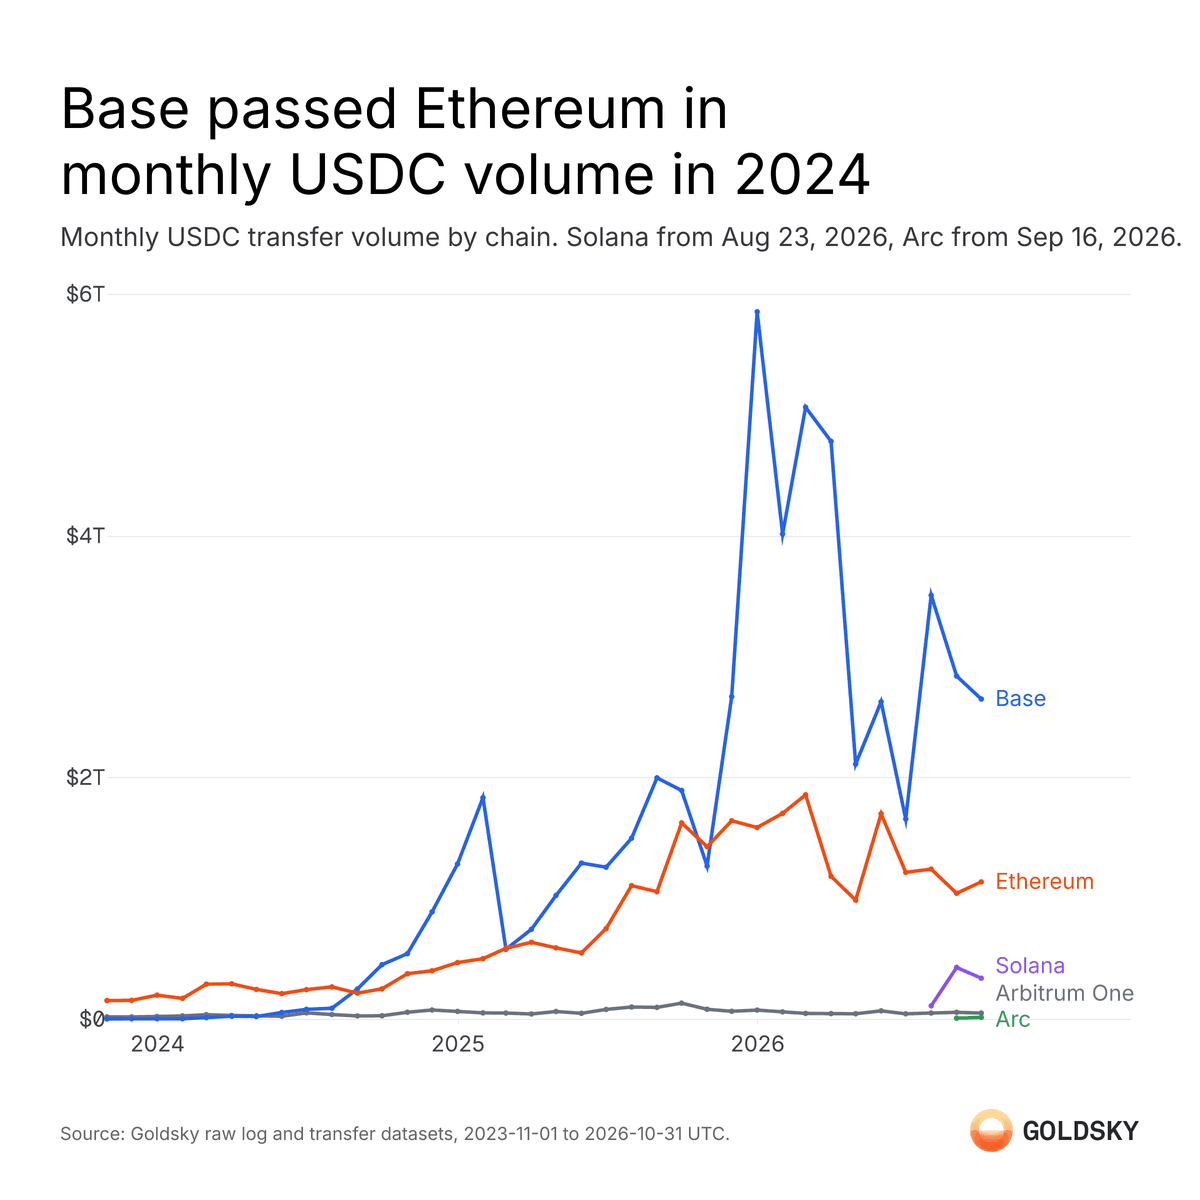
Base passed Ethereum in monthly volume for the first time in September 2024. Ethereum's share of the three-chain total fell from 89.2% to 29.6%. Base's share rose from 0.5% to 69.1%.
The largest monthly increases in the three-chain total were:
- December 2025 to January 2026: +71.8%
- February 2024 to March 2024: +69.4%
- July 2026 to August 2026: +64.7%
- November 2025 to December 2025: +57.7%
Base's largest month was January 2026, with $5.85 trillion from 145.9 million transfers. A check for duplicate log rows in that month found none. Single transfers of $100 million or more were 2.6% of Base's January 2026 volume. They were 78.4% of June 2026 and 43.3% of October 2026. Without those transfers, Base's October 2026 volume was $1,502.3 billion.
All figures in this post are raw onchain volume. They are not adjusted for bot activity or for repeated transfers inside one transaction.
Arc: the first 6 weeks
Arc is Circle's layer 1 blockchain. Its weekly USDC volume in its first 6 weeks was:
| Week from 2026-09-16 | Volume (USDC) | Transfers |
|---|---|---|
| 1 | $3.81 billion | 15,252,711 |
| 2 | $2.03 billion | 5,848,792 |
| 3 | $2.71 billion | 4,016,430 |
| 4 | $2.41 billion | 1,750,984 |
| 5 | $2.33 billion | 1,377,182 |
| 6 | $3.33 billion | 901,914 |
The weekly transfer count fell 94% from week 1 to week 6. Weekly volume in week 6 was 87% of week 1.
Stablecoin rules and USDC volume
The table compares the three-chain monthly volume in the month before and the month after each event.
| Date | Event | Month before | Month after | Change |
|---|---|---|---|---|
| 2024-06-30 | EU MiCA stablecoin titles apply (opens in a new tab) | $291.4B (May 2024) | $373.5B (Jul 2024) | +28.2% |
| 2024-12-30 | EU MiCA applies in full | $971.9B (Nov 2024) | $1,812.8B (Jan 2025) | +86.5% |
| 2025-06-17 | US Senate passes the GENIUS Act (opens in a new tab), 68-30 | $1,673.4B (May 2025) | $2,083.8B (Jul 2025) | +24.5% |
| 2025-07-18 | GENIUS Act signed into law (opens in a new tab) | $1,884.8B (Jun 2025) | $2,698.6B (Aug 2025) | +43.2% |
| 2025-08-01 | Hong Kong Stablecoins Ordinance in force (opens in a new tab) | $2,083.8B (Jul 2025) | $3,145.6B (Sep 2025) | +51.0% |
| 2026-09-15 | CLARITY Act fails a Senate cloture vote (opens in a new tab), 49-50 | $4,796.5B (Aug 2026) | $3,832.2B (Oct 2026) | -20.1% |
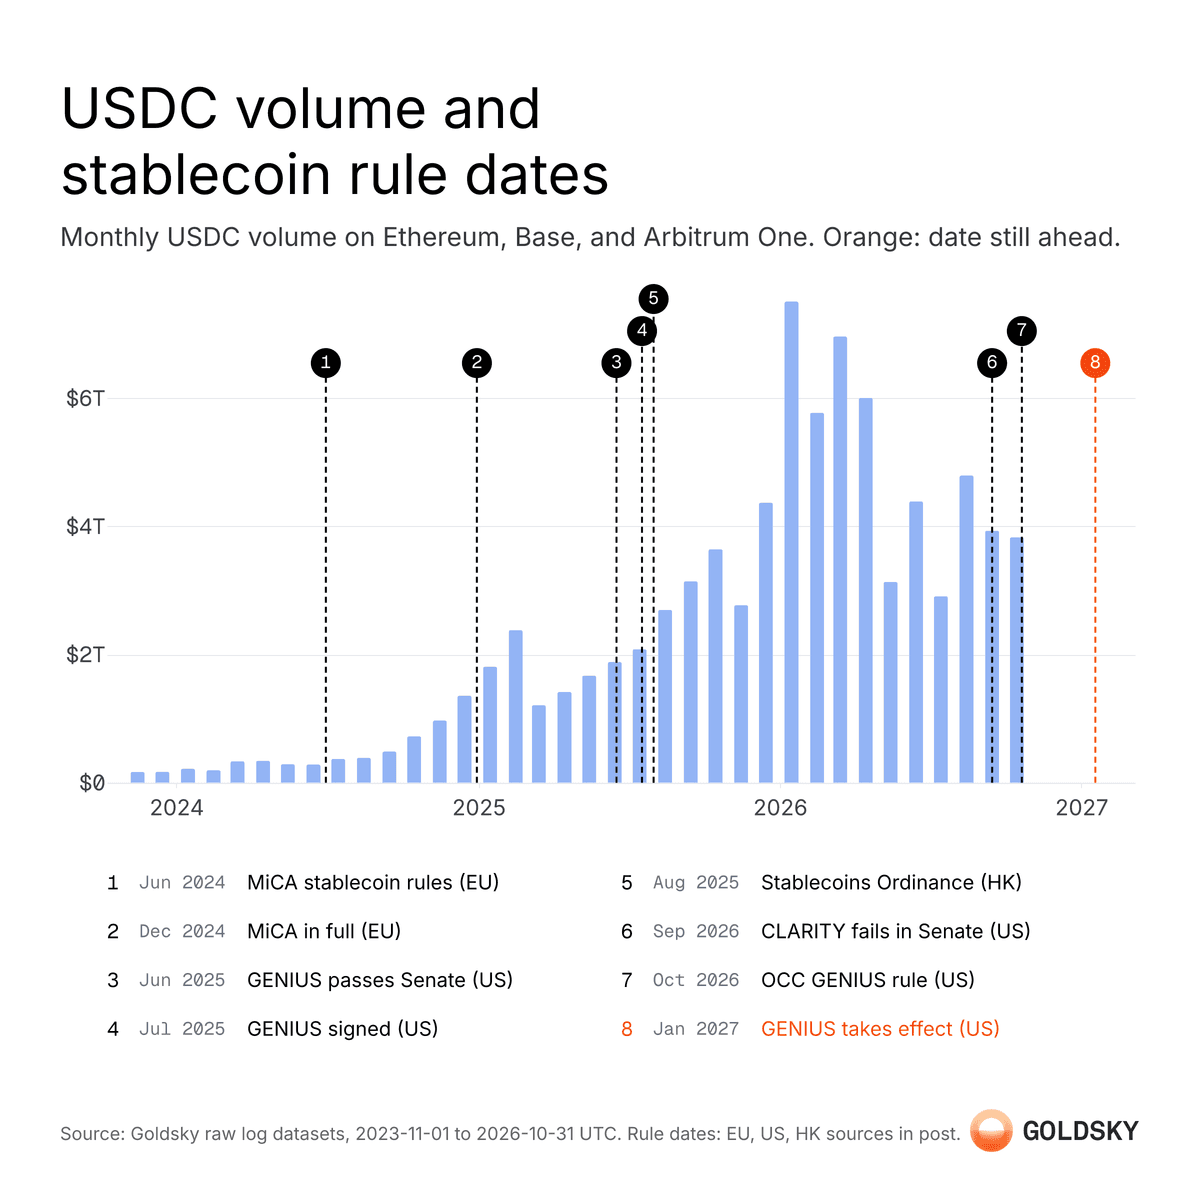
Volume was higher after each of the 5 rules that passed or took effect. It was 20.1% lower after the failed CLARITY Act vote. Volume also rose in 19 of the 28 two-month windows with no rule event. These numbers do not show that a rule caused a change.
Three steps are still ahead:
- The OCC final rule for the GENIUS Act (opens in a new tab) came out on 2026-10-21. The GENIUS Act takes effect on 2027-01-18, or 120 days after final rules if that is earlier.
- From 2028-07-18, section 3(b)(1) of the GENIUS Act (opens in a new tab) bars digital asset service providers from offering a payment stablecoin that a permitted issuer did not issue.
- The CLARITY Act (H.R. 3633) passed the House on 2025-07-17. It has not passed the Senate.
Method
Ethereum, Base, and Arbitrum One volume comes from each chain's USDC Transfer event logs in Goldsky's raw log datasets. The counts include mints and burns, because they also emit a Transfer event. The Ethereum query removes duplicate log rows left by chain reorganizations, 0.5% of rows over 3 years. Solana volume comes from Goldsky's curated Solana stablecoin transfer dataset, filtered to the USDC mint address. Arc volume comes from a Goldsky Turbo pipeline that streams Arc ERC-20 transfers into ClickHouse.
-- Base, 7-day window. Ethereum and Arbitrum One use the same pattern with their own USDC contract address.
SELECT
  multiIf(splitByChar(',', topics)[2] = '0x0000000000000000000000000000000000000000000000000000000000000000', 'mint',
          splitByChar(',', topics)[3] = '0x0000000000000000000000000000000000000000000000000000000000000000', 'burn',
          'transfer') AS transfer_type,
  count() AS transfer_count,
  sum(reinterpretAsUInt256(reverse(unhex(substring(data, 3))))) / 1e6 AS volume_usdc
FROM base_raw_logs
WHERE address = '0x833589fcd6edb6e08f4c7c32d4f71b54bda02913'
  AND splitByChar(',', topics)[1] = '0xddf252ad1be2c89b69c2b068fc378daa952ba7f163c4a11628f55a4df523b3ef'
  AND is_deleted = 0
  AND block_timestamp >= '2026-10-26 00:00:00'
  AND block_timestamp < '2026-11-02 00:00:00'
GROUP BY transfer_typeFAQ
Which chains does this tracker cover?
Ethereum, Base, Solana, Arbitrum One, and Arc. The monthly data starts in November 2023 for Ethereum, Base, and Arbitrum One. It starts on 2026-08-23 for Solana and on 2026-09-16 for Arc.
What counts as a mint, a burn, or a transfer?
A mint comes from the zero address. A burn goes to the zero address. Every other movement is a transfer between two holders.
Why does Solana have the most transfers but less volume than Ethereum?
The average Solana USDC transfer in the 7-day window was $949. The average Ethereum USDC transfer was $67,085.
How can a team get this USDC transfer data from Goldsky?
Goldsky Turbo pipelines stream raw logs, ERC-20 transfers, and Solana token transfers into a destination such as ClickHouse or Postgres. A team can filter the pipeline to the USDC contract on each chain.
 Robinhood
 HyperEVM
 Arc
 Solana
 Ethereum
 Polymarket
 Base
 Tempo
 Bitcoin
