Protocol financial statements from chain data
What are protocol financial statements?
Protocol financial statements are income statements for a blockchain or onchain app: the fees users paid, the share the protocol kept as revenue and what it paid out as costs such as rewards and incentives, period by period.
Research firms and asset managers build them to compare protocols the way they compare companies, from a source anyone can check.
Goldsky decodes the fee, reward and payout events from the protocol’s contracts and lands every flow in your warehouse with its block time; pricing each flow, classifying it and totaling the statement follow your method.
Who publishes protocol financial statements?
Crypto research and data firms, digital asset managers, and analysts who value protocols on their fees and revenue.
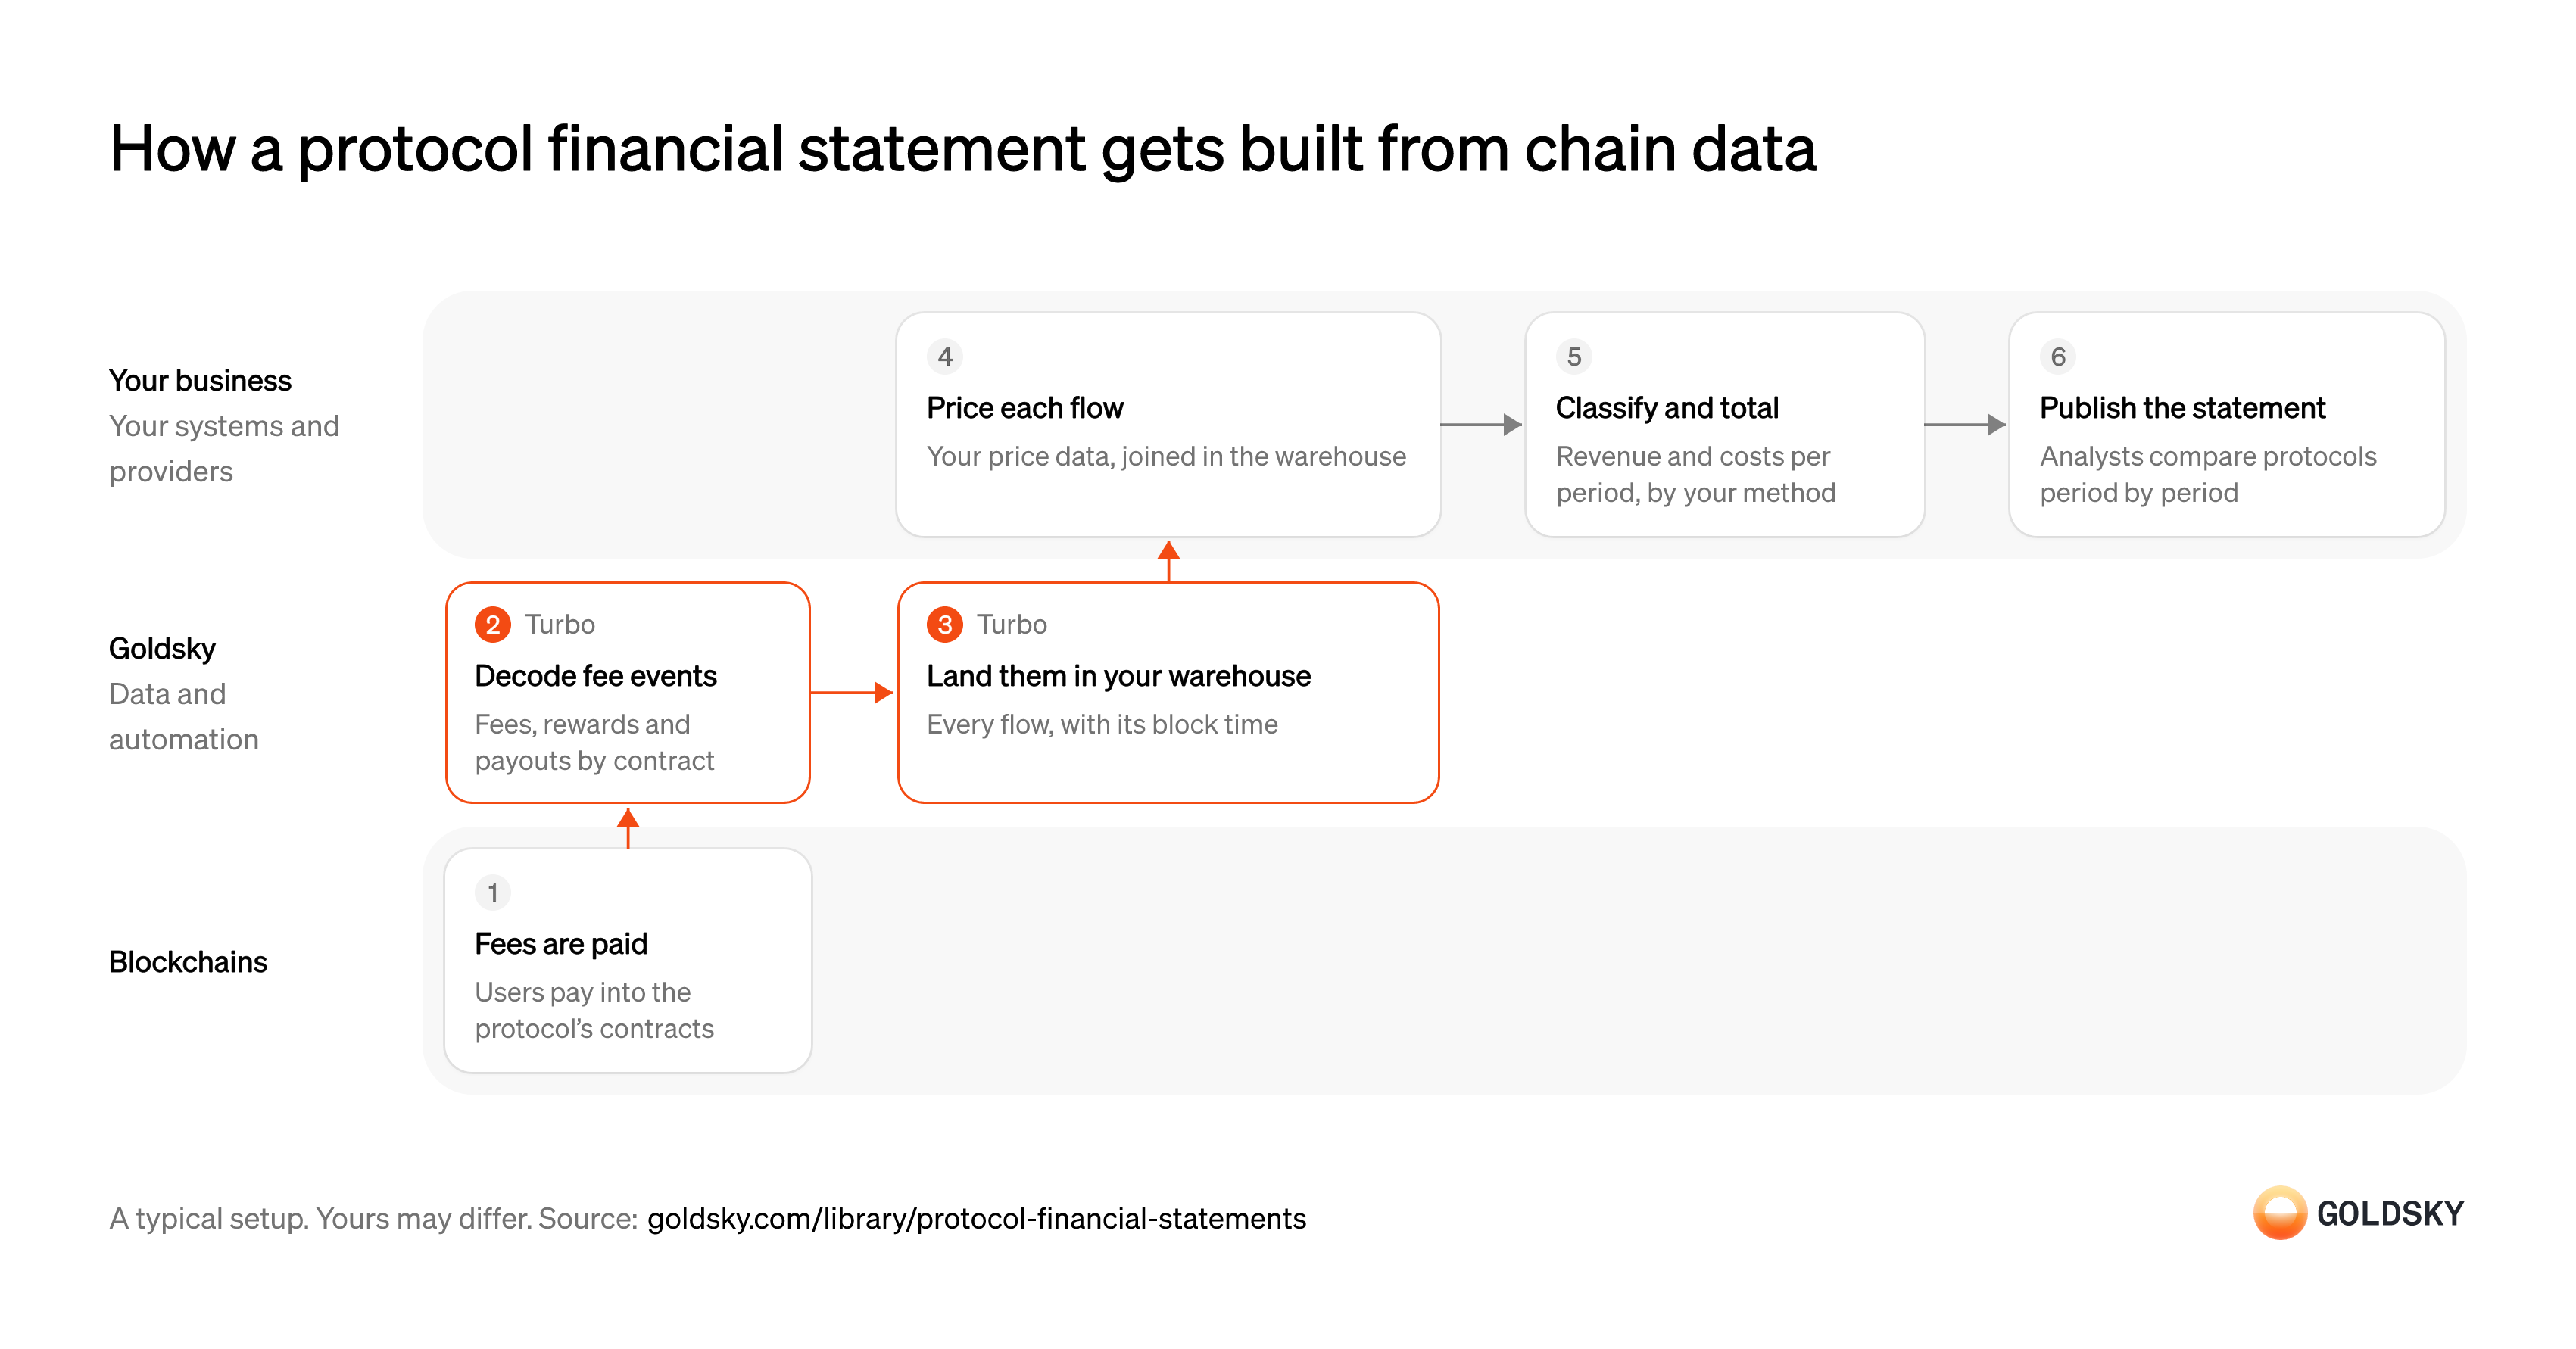
How a protocol financial statement gets built from chain data
The diagram follows one fee from the moment a user pays it into the protocol’s contracts to the statement analysts use to compare protocols. Your setup may differ.
Collect fees from users
A protocol earns when users pay fees into its contracts, the way a company earns from sales.
Fees are paid in many tokens and split between parties such as liquidity providers, the treasury and token holders. Those splits decide what counts as the protocol’s revenue, so you need the events that record each one.
Decode fee, reward and payout events
Handled by Goldsky TurboEach flow has to be read from the contract events that record it before it can be counted.
Every fee, reward and payout event is decoded with the contract’s interface (ABI) into an amount, token and recipient. A contract you leave out, such as a new version of the protocol, quietly understates its income.
With Goldsky, a Turbo Pipelines SQL transform decodes each contract’s logs with
Decode contract events (opens in a new tab)_gs_log_decodeand its ABI, which it can fetch from a block explorer with_gs_fetch_abi.Land every flow in your warehouse
Handled by Goldsky TurboStatements cover past periods too, so you need the full history and every new flow in one place.
Each flow lands with its block time and transaction, so any period can be rebuilt to the block. Flows have to cover the protocol’s whole history, or the first periods of a statement compare against nothing.
Turbo Pipelines can write each flow as Parquet files to S3-compatible storage, partitioned by columns such as date for engines like Athena or DuckDB, and a one-time job mode pipeline can backfill history over a fixed block range.
Write Parquet files to S3 (opens in a new tab)Value each flow in dollars
Fees arrive in many tokens, so each one needs a dollar value from the time it was paid.
Your warehouse joins each flow to your price data at its block time. Using today’s price for an old fee changes past periods every time the market moves.
Classify and total by period
An income statement sorts flows into fees, revenue and costs and adds them up for each period.
Your method decides, for example, whether liquidity provider fees count as revenue or pass through, and whether token incentives are a cost. Write the method down and apply it the same way to every protocol, or comparisons across them mean nothing.
Publish the statement
Analysts compare protocols period by period, so statements go out in a consistent format.
Each figure should trace back to the transactions behind it, so a reader can check any line. When you restate a period, after a method change or a missed contract, say what changed.
What you control
- Your team
- Value each flow in dollars
- Classify and total by period
- Publish the statement
Security and deployment
- SOC 2 Type IIIndependently audited security controls.
- Dedicated infrastructureSingle-tenant options for production workloads.
- Data residencyCloud, on-premises or co-located.
More use cases that analyze onchain activity
- Stablecoin transaction volume and market share by chainMeasure real stablecoin or tokenized-asset volume by chain, with inorganic flows stripped out.
- Track stablecoin issuers and competitors onchainFollow competitors’ and issuers’ supply, mints, burns and holders.
- Onchain research on listed crypto companiesTrack listed companies’ onchain revenue and users before they report earnings.
- Digital asset treasury company holdings and mNAVTrack what listed treasury companies hold onchain, per share, and their mNAV.
- Grant and incentive impact trackingMeasure what grants and incentive programs did to users, volume and TVL, per grantee.
- DAO delegate dashboards and voting power analyticsTrack voting power, delegators and votes per delegate for a token-governed DAO.
- Blockchain ecosystem growth metricsTrack a chain’s active, new and returning addresses, transactions, fees and usage per app, compared with other chains.
- Stablecoin market data for analytics: market cap, supply and activityTrack stablecoin supply and market cap by token, chain and issuer, with holders, active addresses, transfer counts and velocity over time.
Use cases built the same way
- Crypto fair-value pricing from DEX tradesFeed DEX trade prices into principal-market fair-value marks and the VWAPs used to check them.
- Daily stablecoin supply by chain for PS-01 reportsKeep the daily per-chain supply, issued, redeemed, issuer-held, frozen and lost figures that feed the weekly OCC PS-01 report.
- Supply data for stablecoin issuance platformsGive an issuance platform one view of supply across every coin and chain it runs.
- Stablecoin depeg and manipulation alertsAlert the issuer when its coin trades off peg in its own pools or pool activity looks like manipulation, on every chain it runs on.
Build protocol financial statements with Goldsky
We’ll map it to your systems and show you what Goldsky runs, so your team builds the product, not the pipelines underneath it.
 Robinhood
 HyperEVM
 Arc
 Solana
 Ethereum
 Polymarket
 Base
 Tempo
 Bitcoin