Stablecoin transaction volume and market share by chain
What it is
Measuring stablecoin transaction volume and market share by chain means counting every transfer of the tokens you study, removing the flows that aren’t economic activity, and totalling what’s left per token and chain; the same method sizes the market for tokenized real-world assets (RWA market size).
Research teams at banks, asset managers and data providers do it because raw onchain totals are inflated by bots, exchanges moving their own funds and contracts calling each other, and a figure that includes them misleads anyone who plans on it.
Goldsky’s Turbo Pipelines loads the full history of each token’s transfers into your warehouse, and your analysts own the filters, the totals and the published numbers.
Who it’s for
Bank research and strategy teams, asset managers, and data and analytics providers that publish or plan on stablecoin and tokenized-asset figures.
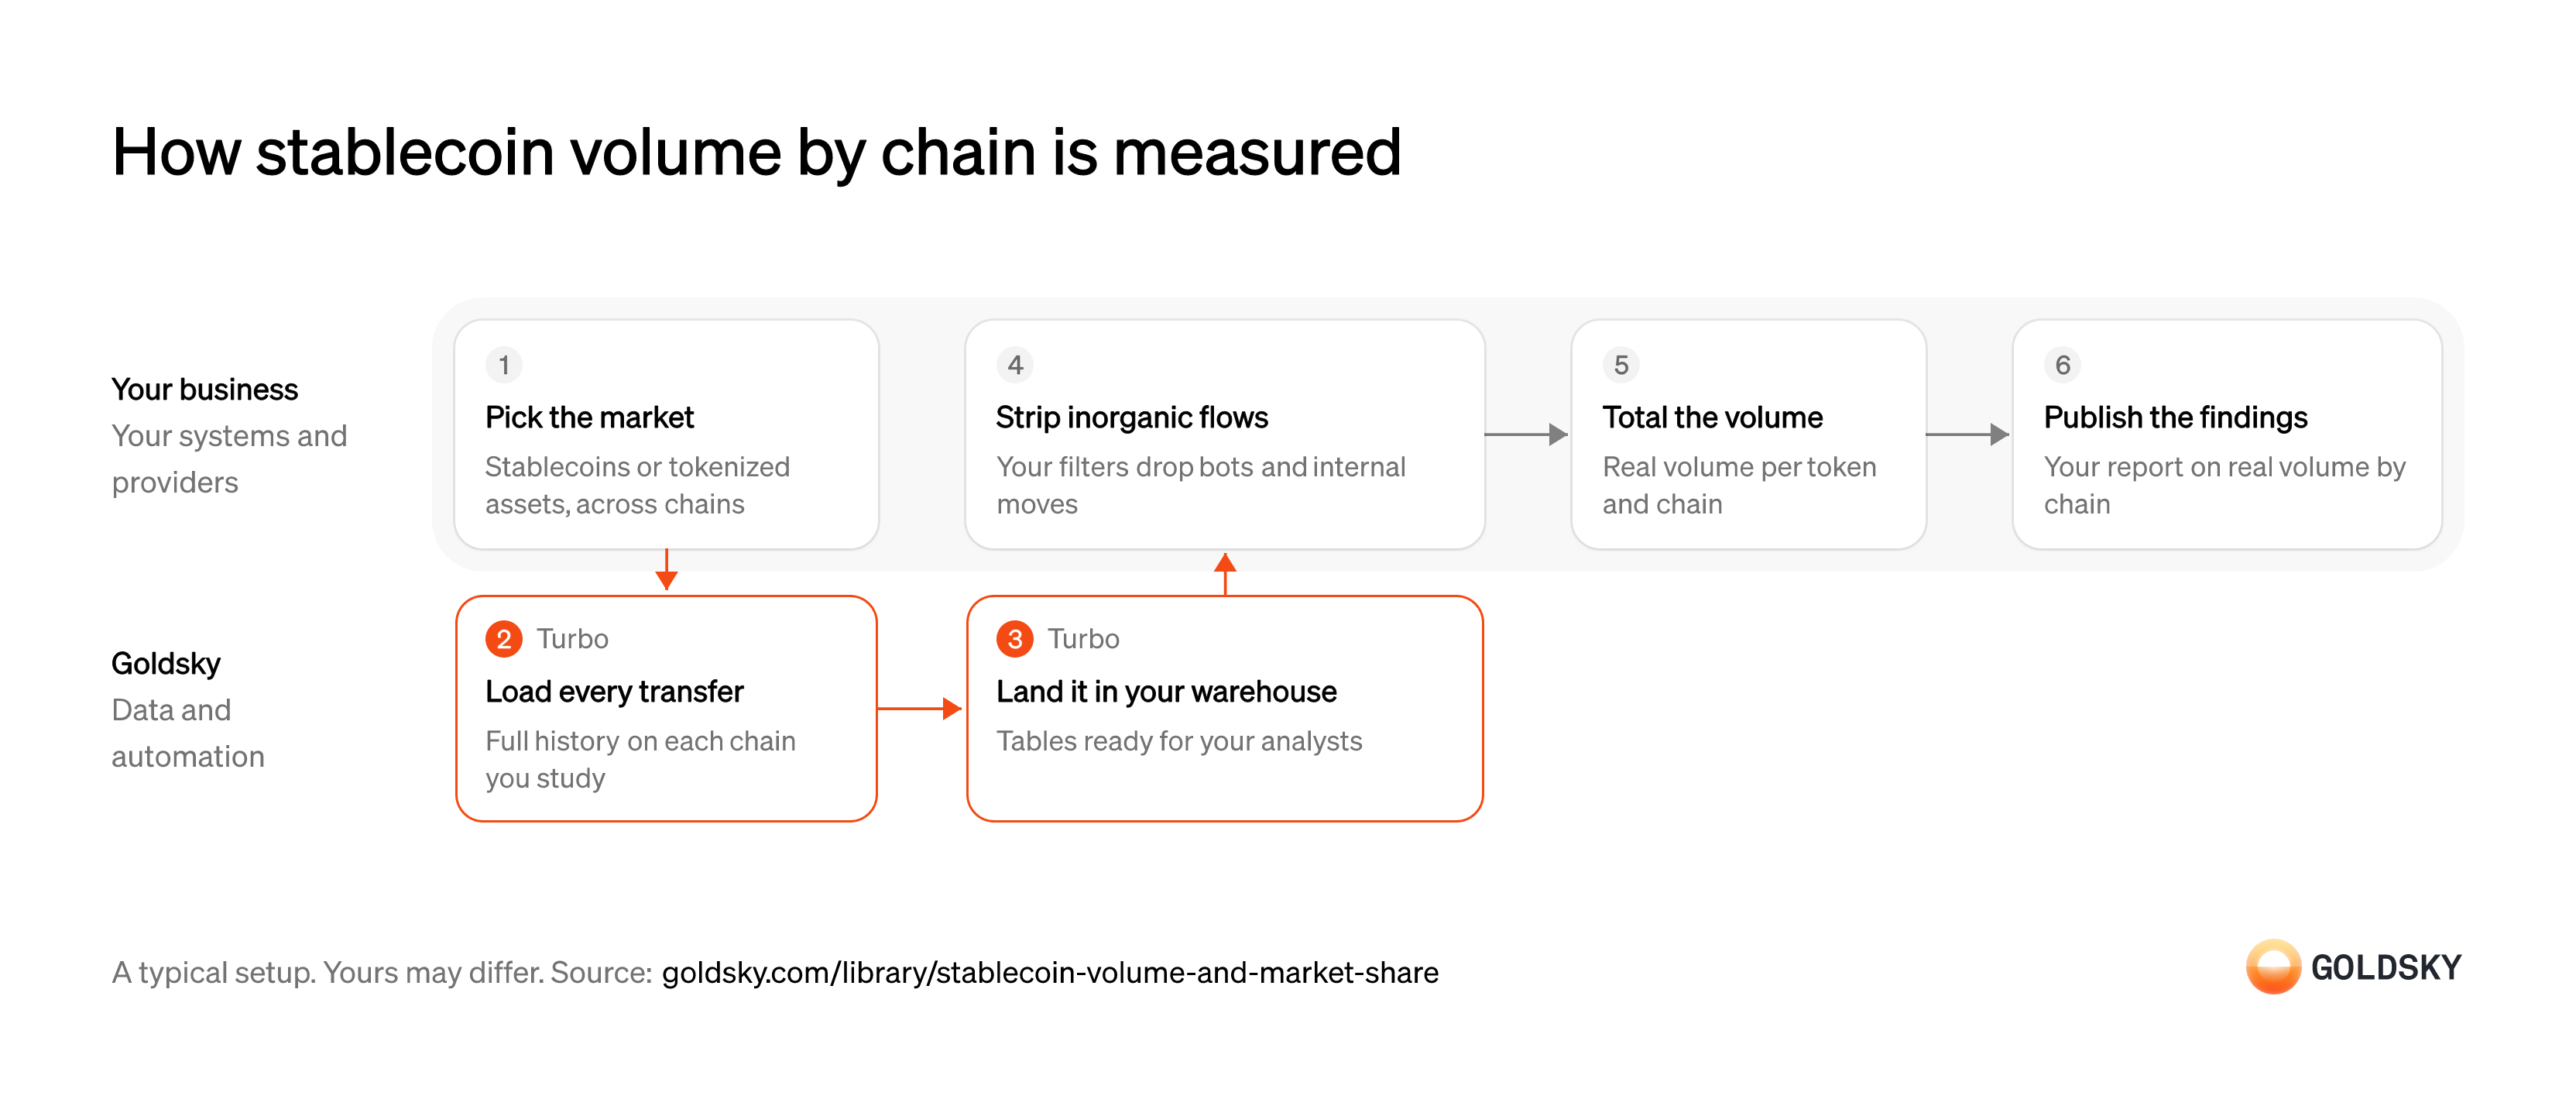
How stablecoin volume by chain is measured
The diagram follows one market study from choosing the market to publishing real volume by chain. Your setup may differ.
Pick the market and the tokens in it
A volume figure is only comparable if everyone knows which tokens, chains and dates it covers.
List each token by its contract address on every chain you study, with the start date for each. Tokens with the same ticker on different chains, or bridged copies of one token, are separate contracts, and missing one makes that chain look smaller than it is.
Load every transfer since the start date
Handled by Goldsky TurboVolume is a sum over transfers, so the study needs every transfer of every token in it.
The history has to be complete for each chain and token from the start date, with amounts in the token’s smallest unit and its decimals alongside. A missing day or chain undercounts that chain without anyone noticing.
With Turbo Pipelines, a job-mode pipeline can scan a chain’s ERC-20 transfers filtered to your token addresses from
Run a historical backfill job (opens in a new tab)start_at: earliestup to a block you set, then exit once the range is done.Land the transfers in your warehouse
Handled by Goldsky TurboAnalysts need one table per study they can query, join with labels and rerun.
Each transfer is written once, with its chain, token, sender, recipient, amount, block and time. Duplicate rows inflate volume, so the table needs a unique key per transfer.
Goldsky writes pipeline output to ClickHouse, S3 as Parquet or a database, and a sink keyed on the transfer
Choose a warehouse sink (opens in a new tab)idwrites each transfer once even when delivery repeats.Strip inorganic flows
Raw totals include bots, exchanges moving their own funds and contracts passing tokens to each other, which aren’t payments between people or firms.
Your analysts set rules to drop transfers between an entity’s own addresses, mints and burns, contract-to-contract hops and known bot activity. Publish the rules with the figures, because two studies with different filters can report different volumes for the same chain.
Total volume per token and chain
The figure readers want is a total by token, chain and period, and each chain’s share of the whole.
Sum amounts adjusted for decimals per token, chain and period in your warehouse, and convert to dollars at the rate you choose. Summing before converting decimals gives figures off by orders of magnitude between tokens.
Publish the findings
The study is done when readers can use the numbers and see how they were made.
Publish volume and market share by chain with the token list, date range and filters. Readers who can’t see the method can’t compare it with other figures they’ve seen.
Related jobs
Load every transfer of the tokens you study
Handled by Goldsky TurboEvery filter you apply later needs the full set of transfers to start from.
Backfill each token’s transfers on every chain you cover, with sender, recipient, amount, time and transaction hash. A chain or month left out changes the base that every share is measured against.
Goldsky’s Turbo Pipelines backfills a token’s transfer history and keeps it current, writing Parquet files to an S3 bucket that your warehouse loads with its own S3 ingestion.
Load transfers into your warehouse (opens in a new tab)Remove protocol mechanics
Some transfers move tokens without anyone paying anyone.
Drop pre-mints, bridge locks and mints, internal contract calls, and anomalies such as test mints of impossible size. Keep the list of contracts you exclude, because readers will ask what was removed.
Count each transaction once
A single swap or routed payment can move the same dollars through several contracts.
Keep only the largest transfer in each transaction, and drop self-transfers and the intermediary hops inside it. Without this step, one payment routed through a trading venue counts several times.
Remove bots and internal movements
Bots, and firms moving their own money, create large volumes that aren’t payments.
Exclude known bot wallets and wallets above a set transaction count or volume in any 30 days, transfers between wallets of the same exchange, and transfers between wallets of the same owner. Address labels decide how much of this you can see, so record which label set each figure used.
Classify what’s left by behavior
The chain records how money moved, not why, so the purpose has to be inferred.
Use transfer size, direction, frequency, counterparty breadth and timing to sort flows into payments between businesses and consumers, trading, and treasury movements. Put anything ambiguous in an unclear category rather than counting it as payments, so the published figure is a lower bound.
Total and publish by chain and token
Readers compare chains and tokens, and they need the method behind the numbers.
Total payment volume per token, chain and month in the warehouse, and publish the method with the figures. Totals across a period are warehouse queries, not pipeline steps.
Pick the currencies, tokens and venues
An FX volume figure is only comparable if readers know which stablecoins stand for each currency and which venues are counted.
Map each stablecoin contract to the currency it tracks on every chain, since one currency can have several stablecoins, and list the pools and settlement contracts that trade one currency’s stablecoin for another’s. A venue left off the list undercounts its pairs without any sign that it did.
Capture every trade on those venues
Handled by Goldsky TurboVolume is a sum over trades, so the study needs every trade from the start date on.
A liquidity pool records each trade as a swap event with both amounts. A venue that settles through an escrow contract records the trade in one event and moves the money as token transfers in the same transaction, so both have to be captured and matched later on the transaction hash.
With Goldsky, Turbo Pipelines can decode the pools’
Decode DEX trades in a pipeline (opens in a new tab)Swapevents from a chain’s raw logs with_gs_log_decode(), starting atearliestfor the history and carrying on as new blocks arrive. The same pipeline can read the token transfers into and out of an escrow contract.Label each trade with its currency pair
Handled by Goldsky TurboA pool trade records token amounts, not currencies or a rate, and readers want volume by pair.
Each row needs the pair, the direction, both amounts divided by each token’s decimals, the rate between them, the venue, the chain and the day. Stablecoins don’t all use the same number of decimals, so raw amounts from different tokens can’t be added or compared.
A SQL transform can set each pool’s pair and decimals with
Learn about SQL transforms (opens in a new tab)CASEon the pool address, and add a day column. A pool missing from theCASEis left out until you add it.Land every trade in your warehouse
Handled by Goldsky TurboAnalysts need one table of trades they can filter, join with address labels and rerun.
Each trade is written once under a unique ID, so a repeated delivery doesn’t count it twice, and a trade removed by a reorg (the chain replacing its newest blocks) has to leave the table too.
Goldsky’s ClickHouse sink, keyed on the trade’s
Set up the ClickHouse sink (opens in a new tab)id, collapses repeated rows and marks rows a reorg removed as deleted.Keep running volume per pair and day
Handled by Goldsky TurboDashboards need current totals without rescanning every trade.
Each trade adds its amounts and a count of one to its pair, venue and day, and a trade the chain removes is taken back out. A trade delivered twice can be counted twice in these running totals, so published figures come from the warehouse table, and totals over rolling periods such as the last 30 days are warehouse queries too.
Turbo Pipelines’
Keep running totals in Postgres (opens in a new tab)postgres_aggregatesink keeps a runningsumof each leg and acountof trades per pair, venue and day in a Postgres table, and subtracts a trade when a reorg deletes it.Remove trades that aren’t FX demand
Some volume moves through FX pools without anyone wanting the other currency.
Arbitrage bots trade to keep pool prices in line with other markets, and routers can pass one swap through several pools, so the same money can count more than once. Decide which of these you keep, label their addresses, and publish the rule with the figures, since studies with different rules report different volumes for the same pair.
Build the corridor and venue tables
Readers want volume per pair and period, the net flow from one currency into another, and each venue’s share.
In the warehouse, total each pair by month, net the two directions of each corridor, convert to dollars at a rate you choose, and rank venues, or the firms behind addresses you’ve labeled, by share. Publish the token list, venues, dates and filters with the tables so readers can compare them with other figures.
What you control
- Your team
- Pick the market and the tokens in it
- Strip inorganic flows
- Total volume per token and chain
- Publish the findings
Security and deployment
- SOC 2 Type IIIndependently audited security controls.
- Dedicated infrastructureSingle-tenant options for production workloads.
- Data residencyCloud, on-premises or co-located.
More use cases that analyze onchain activity
- Track stablecoin issuers and competitors onchainFollow competitors’ and issuers’ supply, mints, burns and holders.
- Protocol financial statements from chain dataBuild income statements (fees, revenue and costs) for chains and apps from their contracts.
- Onchain research on listed crypto companiesTrack listed companies’ onchain revenue and users before they report earnings.
- Digital asset treasury company holdings and mNAVTrack what listed treasury companies hold onchain, per share, and their mNAV.
- Grant and incentive impact trackingMeasure what grants and incentive programs did to users, volume and TVL, per grantee.
- DAO delegate dashboards and voting power analyticsTrack voting power, delegators and votes per delegate for a token-governed DAO.
- Blockchain ecosystem growth metricsTrack a chain’s active, new and returning addresses, transactions, fees and usage per app, compared with other chains.
- Stablecoin market data for analytics: market cap, supply and activityTrack stablecoin supply and market cap by token, chain and issuer, with holders, active addresses, transfer counts and velocity over time.
Use cases built the same way
- DAC8 and CARF reporting dataSupply the valued transfer history behind each user’s yearly DAC8 or CARF report.
- Stablecoin disbursements for public-sector programsTrack government benefit or grant payments made in stablecoins, from issue to spend.
- NCUA stablecoin reporting dataReport supply, mint and burn, and holder figures for a stablecoin issued by a credit union subsidiary under the NCUA’s proposed rules.
- Onchain data for crypto accountingSend priced onchain activity to a crypto subledger so finance can close the books.
Measure stablecoin transaction volume by chain with Goldsky
We’ll map it to your systems and show you what Goldsky runs, so your team builds the product, not the pipelines underneath it.
 Robinhood
 HyperEVM
 Arc
 Solana
 Ethereum
 Polymarket
 Base
 Tempo
 Bitcoin