Track stablecoin issuers and competitors onchain
What it is
Tracking stablecoin issuers and competitors onchain means following each token’s supply through its mints and burns, and who holds it, so you can compare issuers on the same figures.
Issuers, issuance platforms, banks and asset managers do it to see where a rival’s supply is growing, on which chains and among which holders, using the public record on each chain.
Goldsky streams the decoded mints and burns into your warehouse and can rebuild holder lists at any block, while your team sums supply, builds the comparison and runs the dashboards.
You can track stablecoin issuers and competitors two ways: stream mints, burns and holder snapshots into your warehouse with Turbo Pipelines, or keep a subgraph per token that holds its supply behind a GraphQL API.
Who it’s for
Stablecoin and tokenized-fund issuers, issuance platforms, bank strategy teams and asset managers that compare their token with others in the market.
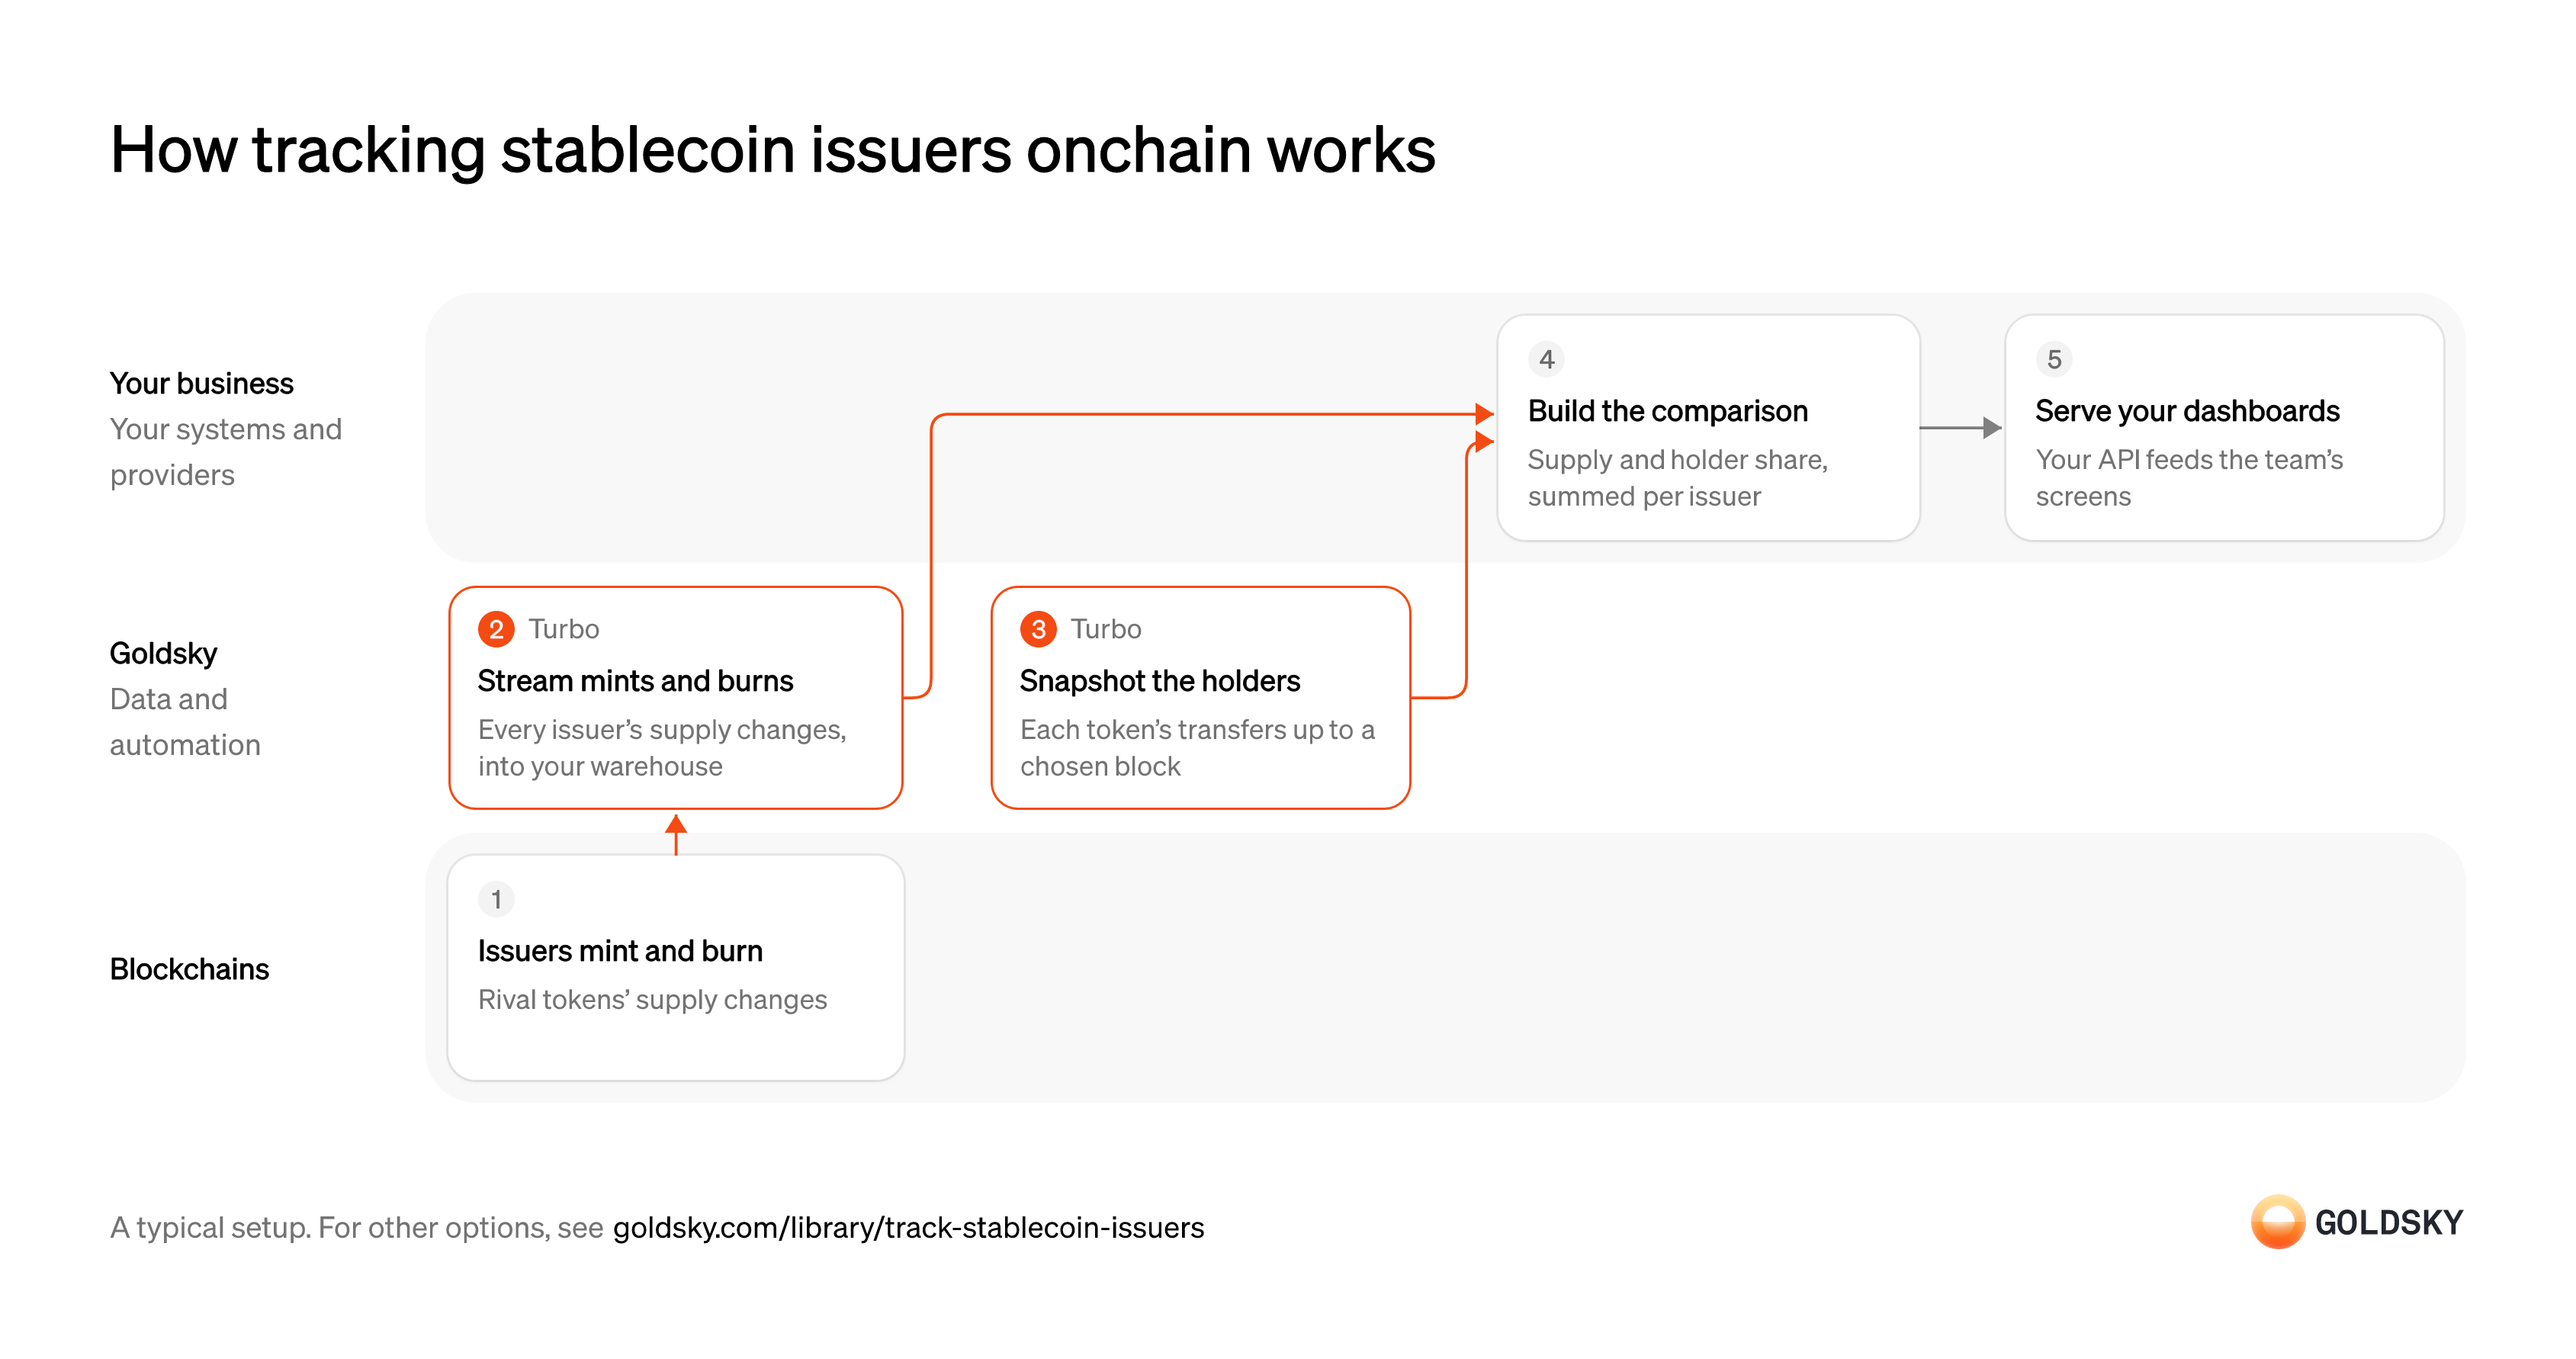
How tracking stablecoin issuers onchain works
The diagram follows issuers minting and burning their tokens through to your team’s dashboards comparing them. Your setup may differ.
Ways to track stablecoin issuers and competitors
Streaming puts every token’s events in your warehouse for your analysts to compare in SQL; a subgraph per token keeps supply and events behind a hosted GraphQL API.
- Best for
- Many tokens across chains, compared in your own warehouse
- Products
- Turbo
- What you run
- The destination: your database, queue or bucket, or a Postgres database Goldsky hosts
- What you write
- Pipeline YAML and SQL; TypeScript transforms when needed
- Where your data lives
- In your own database or systems
- How results reach you
- Pushed to you
- Best for
- A few tokens, for an analyst without a warehouse
- Products
- Subgraphs
- What you run
- Nothing; Goldsky runs indexing, storage and the API
- What you write
- A schema and mapping handlers, or a no-code or low-code config for simple contracts
- Where your data lives
- Hosted by Goldsky
- How results reach you
- You query; changes are pushed
| Usual setupOption 1: Stream to your warehouse | Option 2: Subgraph per token | |
|---|---|---|
| Best for | Many tokens across chains, compared in your own warehouse | A few tokens, for an analyst without a warehouse |
| Products | Turbo | Subgraphs |
| What you run | The destination: your database, queue or bucket, or a Postgres database Goldsky hosts | Nothing; Goldsky runs indexing, storage and the API |
| What you write | Pipeline YAML and SQL; TypeScript transforms when needed | A schema and mapping handlers, or a no-code or low-code config for simple contracts |
| Where your data lives | In your own database or systems | Hosted by Goldsky |
| How results reach you | Pushed to you | You query; changes are pushed |
Record issuers’ mints and burns
A stablecoin’s supply changes only when its issuer mints new tokens or burns redeemed ones, so those events are the supply history.
On most tokens, a mint is a transfer from the zero address and a burn is a transfer to it, and some contracts also emit their own events. You need them for every token and chain you track, or one issuer’s supply looks flat when it isn’t.
Stream decoded mints and burns into your warehouse
Handled by Goldsky TurboAnalysts need each supply change as a row with the token, chain, amount and time.
The stream has to cover every tracked contract and correct rows when a reorg replaces a block. Missing one chain’s contract understates that issuer.
Goldsky’s Turbo Pipelines can filter a chain’s ERC-20 transfers to your token addresses, keep mints and burns with a SQL
Filter stablecoin transfers (opens in a new tab)WHEREon the zero address, and write them to ClickHouse or another warehouse sink.Snapshot the holders at a chosen block
Handled by Goldsky TurboHolder share needs each wallet’s balance at one fixed point, so every token is measured at the same moment.
Balances are rebuilt from every transfer up to the block you pick. Using different blocks for different tokens makes one issuer look larger only because it was measured later.
A one-time Turbo Pipelines job can backfill each token’s transfers up to the block you choose into a table, as in the corporate-actions guide, then exit.
Run a one-time backfill job (opens in a new tab)Build the comparison
The comparison is what the team acts on: supply per issuer and chain, and how holders are spread.
In your warehouse, sum mints minus burns per token and chain for supply, and credits minus debits per wallet for holder balances. Group tokens by issuer so bridged or multi-chain versions of one token count once.
Serve the dashboards
Strategy and sales teams read the comparison on screens, not in the warehouse.
Your API or dashboard tool reads the comparison tables. Show the block or time each figure was taken at, so nobody compares a live number with an old snapshot.
What to know about streaming issuers’ supply to your warehouse
- You own the warehouse tables, the sums and the dashboards; Goldsky runs the pipelines.
- Supply and holder share are totals, which your team computes in the warehouse.
- Holder lists come from a job you run for a chosen block, so you decide how often to take one.
Record issuers’ mints and burns
A stablecoin’s supply changes only when its issuer mints new tokens or burns redeemed ones.
On most tokens, a mint is a transfer from the zero address and a burn is a transfer to it. Each token you track needs its contract on every chain covered.
Index each token’s events
Handled by Goldsky SubgraphsEach token’s transfers, mints and burns need to be stored as records you can query.
Give the indexer each token’s address and the events to keep. A wrong address or a missing chain leaves that issuer out of the comparison.
The
Create a no-code subgraph (opens in a new tab)goldsky subgraph initwizard builds a no-code subgraph from a contract address, fetches the ABI and deploys it, with no mapping code to write.Keep a running supply total
Handled by Goldsky SubgraphsSupply is the sum of every mint minus every burn, so someone has to keep that sum.
The total has to update on each mint and burn and roll back when a reorg removes one. A subgraph written from source can keep the total in its mapping code, which then becomes yours to maintain.
Subgraphs runs the mapping code you deploy from source with
Deploy a subgraph from source (opens in a new tab)goldsky subgraph deploy, so a handler can update a supply record on every mint and burn.Query supply over GraphQL
Handled by Goldsky SubgraphsYour team needs the figures in its dashboards or notebooks.
Each subgraph has its own GraphQL endpoint, so a dashboard comparing issuers queries each one and lines the results up by time. Take each figure at the same block, or the comparison is off.
Each deployed subgraph gets its own hosted GraphQL endpoint, which a dashboard or notebook can query directly.
How Subgraphs serve data (opens in a new tab)Build the comparison
The team acts on supply per issuer side by side.
Your dashboard groups tokens by issuer and compares supply over time. Holder share across many wallets is harder to get this way, so add it from a warehouse if the team needs it.
What to know about a subgraph per token
- Goldsky hosts each subgraph and its API; you deploy and query them.
- A no-code subgraph indexes events without code; a running supply total needs mapping code you write.
- Each token is its own subgraph, so comparing many tokens means querying many endpoints.
What you control
- Your team
- Build the comparison
- Serve the dashboards
Security and deployment
- SOC 2 Type IIIndependently audited security controls.
- Dedicated infrastructureSingle-tenant options for production workloads.
- Data residencyCloud, on-premises or co-located.
More use cases that analyze onchain activity
- Stablecoin transaction volume and market share by chainMeasure real stablecoin or tokenized-asset volume by chain, with inorganic flows stripped out.
- Protocol financial statements from chain dataBuild income statements (fees, revenue and costs) for chains and apps from their contracts.
- Onchain research on listed crypto companiesTrack listed companies’ onchain revenue and users before they report earnings.
- Digital asset treasury company holdings and mNAVTrack what listed treasury companies hold onchain, per share, and their mNAV.
- Grant and incentive impact trackingMeasure what grants and incentive programs did to users, volume and TVL, per grantee.
- DAO delegate dashboards and voting power analyticsTrack voting power, delegators and votes per delegate for a token-governed DAO.
- Blockchain ecosystem growth metricsTrack a chain’s active, new and returning addresses, transactions, fees and usage per app, compared with other chains.
- Stablecoin market data for analytics: market cap, supply and activityTrack stablecoin supply and market cap by token, chain and issuer, with holders, active addresses, transfer counts and velocity over time.
Use cases built the same way
- Supply data for stablecoin issuance platformsGive an issuance platform one view of supply across every coin and chain it runs.
- GENIUS Act stablecoin reporting dataFile the weekly OCC PS-01 report from daily per-chain supply, freeze and holder data.
- Stablecoin holder concentration reportingList every wallet holding over 2% of supply and the top 20 redemption wallets each day, for the weekly PS-01 report.
- NCUA stablecoin reporting dataReport supply, mint and burn, and holder figures for a stablecoin issued by a credit union subsidiary under the NCUA’s proposed rules.
Track stablecoin issuers and competitors onchain with Goldsky
We’ll map it to your systems and show you what Goldsky runs, so your team builds the product, not the pipelines underneath it.
 Robinhood
 HyperEVM
 Arc
 Solana
 Ethereum
 Polymarket
 Base
 Tempo
 Bitcoin