Stablecoin market data for analytics: market cap, supply and activity
What is stablecoin market cap?
Stablecoin market cap is the dollar value of every stablecoin in circulation; tracking it by chain and issuer means keeping each token’s stablecoin supply current on every chain, along with holders, active addresses, transfer counts and velocity.
Bank and fintech strategy teams, issuers and data providers use these stablecoin statistics to size the market and decide where to launch or integrate, and they depend on the figures matching the chain: a stablecoin dashboard that counts a bridged token twice overstates the market.
With Goldsky’s Turbo Pipelines, you can stream every transfer of the stablecoins you count into your warehouse and work out each figure there, or keep supply, holder balances and daily counts as running totals in Postgres.
Who tracks stablecoin market cap?
Bank and fintech strategy teams, stablecoin issuers, asset managers, and data and analytics providers that publish or plan on stablecoin market figures.
How stablecoin market data is collected
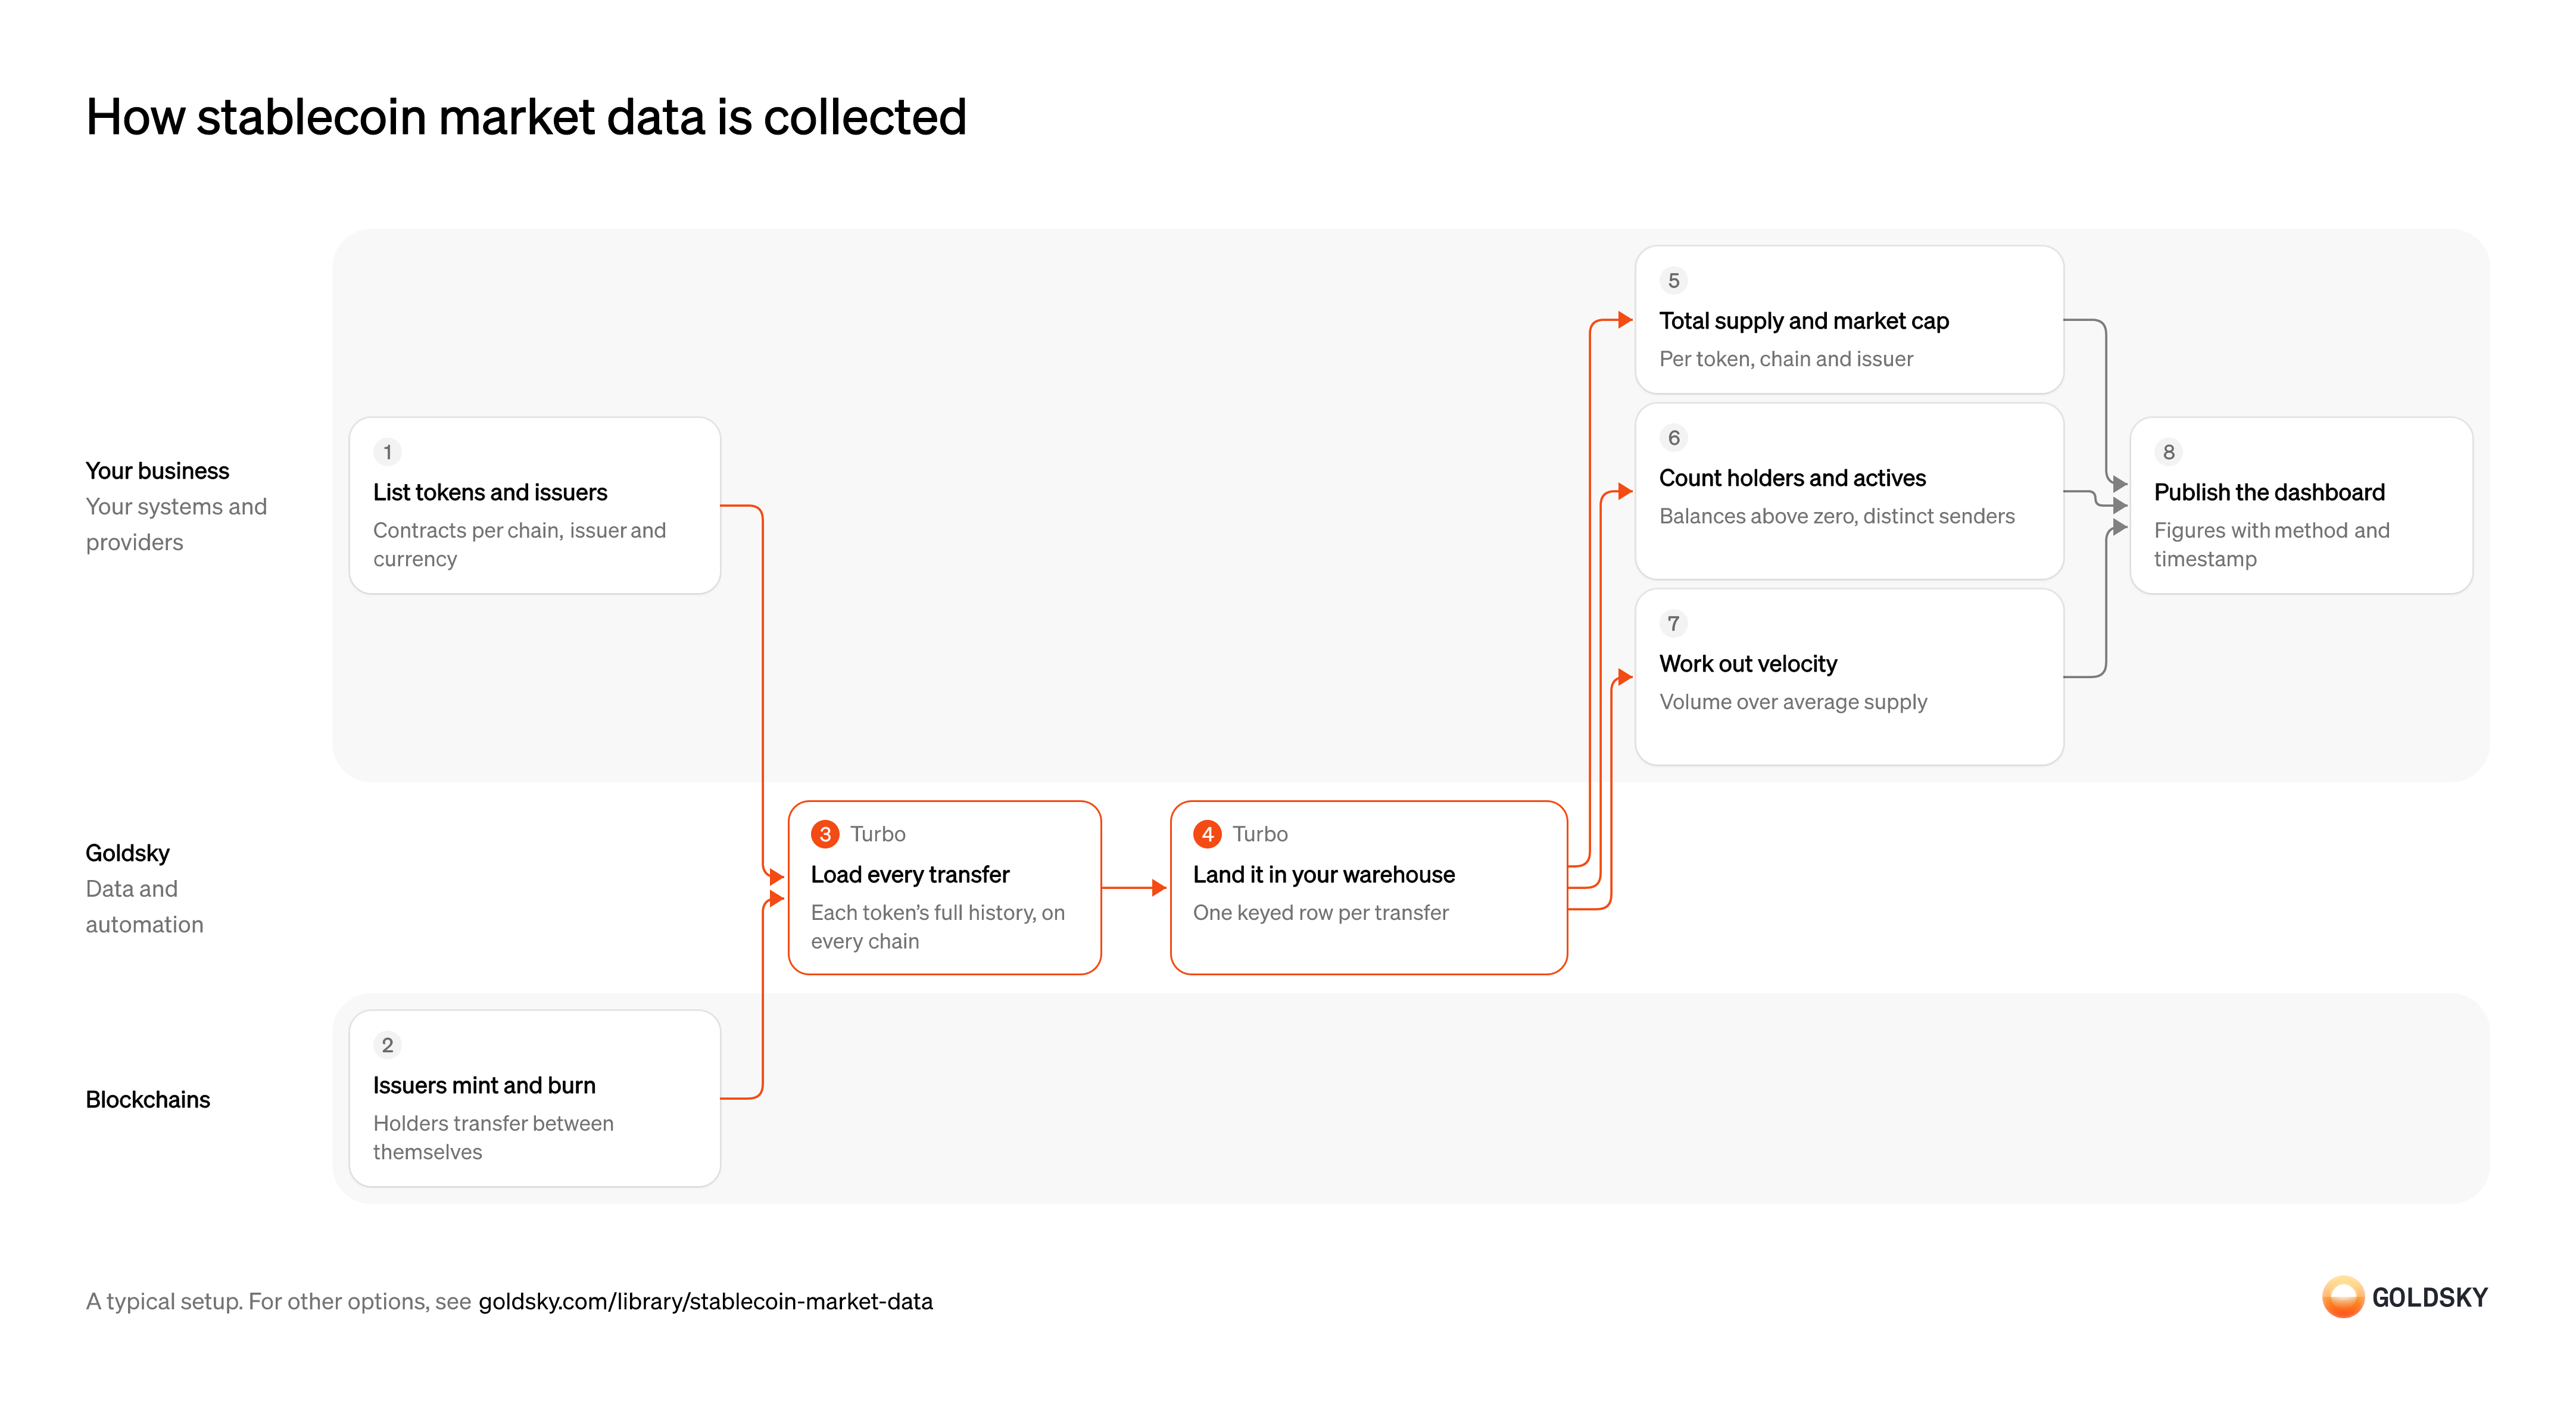
The diagram follows the tokens you count from issuers minting and burning them onchain to your dashboard showing supply, holders and activity by chain and issuer. Your setup may differ.
Ways to collect stablecoin market data for analytics
Streaming to a warehouse keeps every transfer, so analysts can work out any figure over any period and rebuild it when a rule changes; running totals in Postgres keep supply and balances current as each block lands, for a live dashboard with no warehouse to run.
- Best for
- Many tokens and chains, with full history in your warehouse
- Products
- Turbo
- Where the figures are worked out
- Your warehouse queries, over every transfer
- A repeated delivery
- Collapsed on each transfer’s key
- Best for
- A live supply and holder dashboard, without a warehouse
- Products
- Turbo
- Where the figures are worked out
- Postgres totals updated as each block lands
- A repeated delivery
- Can add to a running total twice
| Usual setupOption 1: Stream to your warehouse | Option 2: Running totals in Postgres | |
|---|---|---|
| Best for | Many tokens and chains, with full history in your warehouse | A live supply and holder dashboard, without a warehouse |
| Products | Turbo | Turbo |
| Where the figures are worked out | Your warehouse queries, over every transfer | Postgres totals updated as each block lands |
| A repeated delivery | Collapsed on each transfer’s key | Can add to a running total twice |
List the tokens, chains and issuers you count
Market cap is only comparable when readers know which tokens count as stablecoins and which issuer stands behind each.
Map each token contract on every chain to its issuer and the currency it tracks, and mark which contracts the issuer runs and which are bridged copies. A bridged copy whose original stays locked on another chain counts the same dollars twice if both go into supply.
Issuers mint and burn, holders transfer
Supply changes only when an issuer mints new tokens or burns redeemed ones, and everything else is tokens moving between holders.
On most tokens a mint is a transfer from the zero address and a burn is a transfer to it, and some contracts also emit their own mint and burn events. A bridge locks or burns tokens on one chain while its contract mints them on another.
Load every transfer since each token launched
Handled by Goldsky TurboSupply, holders and activity are all sums over transfers, so every transfer of every token you count is needed from its first mint on.
The history has to start at each token’s first block on each chain, with amounts in the token’s smallest unit and its decimals alongside. A token loaded from a later date shows a supply that’s off by everything minted before it.
With Turbo Pipelines, a source on each chain’s
Stream stablecoin transfers (opens in a new tab)erc20_transfersdataset, filtered to your token addresses and tagged with chain and symbol columns in SQL, reads every transfer fromstart_at: earliestand keeps streaming new ones. On Solana, thesolana.stablecoin_transfersdataset already labels each transfer with itssymbol, thecurrencyit tracks and whether it’s a mint or burn.Land the transfers in your warehouse
Handled by Goldsky TurboAnalysts need one table of transfers they can query, join with labels and rerun.
Each transfer is written once under a unique key, so a repeated delivery doesn’t add to supply twice, and one removed by a reorg (the chain replacing its newest blocks) has to leave the table too.
Goldsky’s ClickHouse sink, keyed on the transfer
Set up the ClickHouse sink (opens in a new tab)id, collapses repeated rows and marks rows a reorg removed as deleted; Snowflake, BigQuery and Databricks load the S3 sink’s Parquet files and dedupe on the same key.Total supply and market cap
Supply is every mint minus every burn, and market cap is that supply valued in dollars.
Sum mints minus burns per token, chain and day, carry the running total forward, and count each bridged token on one chain only, by a rule you state. Multiply by the token’s price, or by one for a token you treat as holding its peg, and group tokens by issuer.
Count holders and active addresses
Holders show how widely a token is held, and active addresses show how many use it.
A holder is an address with a balance above zero, worked out as credits minus debits per address; active addresses are distinct senders per day or month. One exchange address can hold for millions of customers, so leave out issuer treasuries, bridges and exchanges if you report users.
Work out transfer counts and velocity
Transfer counts and velocity show how much the supply is used, not just how much exists.
Count transfers and sum amounts per token, chain and day, then divide the volume in a period by the average supply in it for velocity. Raw volume includes bots, exchanges moving their own funds and contracts passing tokens to each other; strip those first, as in measuring stablecoin transaction volume, for velocity from payments.
Publish the dashboard
Strategy teams, clients and readers use the figures only when they can see how they were made.
Show each figure with its token list, chain coverage, price source and the time it was taken. Other stablecoin statistics may count bridged supply or holders differently, and readers need the method to compare them.
What to know about streaming stablecoin transfers to your warehouse
- Goldsky runs the pipelines; your team owns the token list, the warehouse tables and every total.
- Supply, holders and velocity are warehouse queries, so a new rule for bridged tokens reruns over history without reloading it.
- On Solana, a curated dataset labels each stablecoin’s symbol and currency; on EVM chains, the token list is yours to keep.
- A transfer a reorg removes is deleted from keyed tables, so supply converges on the chain.
List the tokens, chains and issuers you count
Market cap is only comparable when readers know which tokens count as stablecoins and which issuer stands behind each.
Map each token contract on every chain to its issuer and the currency it tracks, and mark which contracts the issuer runs and which are bridged copies. A bridged copy whose original stays locked on another chain counts the same dollars twice if both go into supply.
Issuers mint and burn, holders transfer
Supply changes only when an issuer mints new tokens or burns redeemed ones, and everything else is tokens moving between holders.
On most tokens a mint is a transfer from the zero address and a burn is a transfer to it, and some contracts also emit their own mint and burn events. A bridge locks or burns tokens on one chain while its contract mints them on another.
Load every transfer since each token launched
Handled by Goldsky TurboSupply, holders and activity are all sums over transfers, so every transfer of every token you count is needed from its first mint on.
The history has to start at each token’s first block on each chain, with amounts in the token’s smallest unit and its decimals alongside. A token loaded from a later date shows a supply that’s off by everything minted before it.
With Turbo Pipelines, a source on each chain’s
Stream stablecoin transfers (opens in a new tab)erc20_transfersdataset, filtered to your token addresses and tagged with chain and symbol columns in SQL, reads every transfer fromstart_at: earliestand keeps streaming new ones. On Solana, thesolana.stablecoin_transfersdataset already labels each transfer with itssymbol, thecurrencyit tracks and whether it’s a mint or burn.Keep supply per token and chain
Handled by Goldsky TurboSupply is the one figure everything else is measured against, so it should be current as each mint or burn lands.
Only mints and burns change supply: each mint adds its amount and each burn takes it away, per token and chain. A mint the chain later removes has to come back out, or supply drifts above the chain’s.
With Goldsky, a Turbo Pipelines SQL step keeps transfers from or to the zero address and signs burns negative, and a
Keep running totals in Postgres (opens in a new tab)postgres_aggregatesink sums them per token and chain in a Postgres table, subtracting any a reorg deletes as long as the SQL keeps the_gs_opcolumn that marks deletes. Asumadds an updated row again instead of replacing it, so the running supply is a live view, checked against a recount before you publish.Keep each holder’s balance
Handled by Goldsky TurboHolder counts and concentration need a current balance for every address.
Every transfer is a debit for the sender and a credit for the recipient, and the balance is their running sum. A balance kept only from credits counts every address that ever received the token as a holder.
Goldsky’s balance pattern turns each transfer into two rows with
See the balance pattern (opens in a new tab)UNION ALL, minus for the sender and plus for the recipient, and apostgres_aggregatesink sums them per holder and token. Both halves keep the_gs_opcolumn, so a transfer a reorg deletes comes off both balances.Count transfers per token and day
Handled by Goldsky TurboDaily transfer counts and amounts are the base for activity and velocity charts.
Each transfer adds one to its token’s count for the day and its amount to the day’s total, per chain. Active addresses need one more grouping, by sender and day, so each address gets one row per day it sent.
Another
Group running totals by key (opens in a new tab)postgres_aggregatesink keeps acountand asumper token, chain and day, with the day set in the SQL step from each transfer’s block timestamp.Work out holders, actives and velocity
The totals become market figures once your queries read them.
Count holders with a balance above zero, count rows per day for active addresses, divide a period’s transfer amounts by its average supply for velocity, and value supply in dollars at the price you choose. Group tokens by issuer and count each bridged token on one chain only.
Recount before you publish
Running totals suit a live dashboard, but a published figure needs to match the chain exactly.
Check a published figure against a recount over the same period, from a table keyed on each transfer or from the token’s supply on the chain. A gap is a repeated delivery or a corrected row the totals didn’t apply, and the recount is the one to trust.
What to know about running totals in Postgres
- Supply and balances change as each block lands, and a mint or transfer a reorg deletes is taken back out.
- A running
sumcan’t apply an updated row and a delivery repeated across checkpoints can count twice, so recount a figure before you publish it. - A balance for every holder means a write on every transfer, so the database sets the pace for large tokens.
- Velocity, rolling windows and dollar values are your SQL over the totals.
What you control
- Your team
- List the tokens, chains and issuers you count
- Total supply and market cap
- Count holders and active addresses
- Work out transfer counts and velocity
- Publish the dashboard
Questions and answers
What is stablecoin supply?
Stablecoin supply is the number of tokens in circulation: everything an issuer has minted minus everything it has burned on redemption. Market cap is that supply valued in dollars. A token bridged from one chain to another can show up on both, once as the locked original and once as the bridged copy, so count it on one chain only.
What is stablecoin velocity?
Stablecoin velocity is how many times the average token changes hands in a period: the transfer volume in the period divided by the average supply. Raw volume includes bots, exchanges moving their own funds and contracts passing tokens to each other, so analysts often strip those flows first and report velocity from the payments that remain.
Security and deployment
- SOC 2 Type IIIndependently audited security controls.
- Dedicated infrastructureSingle-tenant options for production workloads.
- Data residencyCloud, on-premises or co-located.
More use cases that analyze onchain activity
- Stablecoin transaction volume and market share by chainMeasure real stablecoin or tokenized-asset volume by chain, with inorganic flows stripped out.
- Track stablecoin issuers and competitors onchainFollow competitors’ and issuers’ supply, mints, burns and holders.
- Protocol financial statements from chain dataBuild income statements (fees, revenue and costs) for chains and apps from their contracts.
- Onchain research on listed crypto companiesTrack listed companies’ onchain revenue and users before they report earnings.
- Digital asset treasury company holdings and mNAVTrack what listed treasury companies hold onchain, per share, and their mNAV.
- Grant and incentive impact trackingMeasure what grants and incentive programs did to users, volume and TVL, per grantee.
- DAO delegate dashboards and voting power analyticsTrack voting power, delegators and votes per delegate for a token-governed DAO.
- Blockchain ecosystem growth metricsTrack a chain’s active, new and returning addresses, transactions, fees and usage per app, compared with other chains.
Use cases built the same way
- DAC8 and CARF reporting dataSupply the valued transfer history behind each user’s yearly DAC8 or CARF report.
- Stablecoin disbursements for public-sector programsTrack government benefit or grant payments made in stablecoins, from issue to spend.
- NCUA stablecoin reporting dataReport supply, mint and burn, and holder figures for a stablecoin issued by a credit union subsidiary under the NCUA’s proposed rules.
- Onchain data for crypto accountingSend priced onchain activity to a crypto subledger so finance can close the books.
Collect stablecoin market data for analytics with Goldsky
We’ll map it to your systems and show you what Goldsky runs, so your team builds the product, not the pipelines underneath it.
 Robinhood
 HyperEVM
 Arc
 Solana
 Ethereum
 Polymarket
 Base
 Tempo
 Bitcoin